Imagine this: Your team is handling hundreds of customer queries every day. Emails, chats, and phone calls are pouring in, and it’s getting harder to keep track of who’s doing what. Sounds overwhelming, right? That’s where a customer service dashboard comes in. It’s like a command center for your support team, helping you stay organized, efficient, and focused on delivering exceptional care.
In this blog, we’ll break down everything you need to know about customer service dashboards—what they are, why they matter, and how you can use them to transform your service operations. Plus, we’ll share real-world examples, key metrics to track, and even a free template to get you started. Let’s dive in!
Why Do You Need a Customer Service Dashboard?
Running a customer-focused business without a dashboard is like driving a car without a dashboard. You’re essentially flying blind. Here’s why a customer service dashboard is a game-changer:
- Centralized Information: No more jumping between tools or spreadsheets. A dashboard brings all your customer data into one place.
- Real-Time Insights: Track metrics like response time, resolution time, and customer satisfaction in real time.
- Improved Team Collaboration: Your support team can work smarter, not harder, with clear visibility into tasks and performance.
- Better Decision-Making: Data-driven insights help you identify trends, spot issues, and make informed decisions.
Without a dashboard, you risk missing critical customer queries, delaying responses, and ultimately losing trust. A dashboard ensures your service team stays on top of their game while keeping customers happy.
Key Metrics to Track on a Customer Service Dashboard
A customer service dashboard is only as good as the metrics you track. Here are the most important ones to monitor:
- Response Time: How quickly your team responds to customer queries. Faster responses mean happier customers.
- Resolution Time: The time it takes to resolve an issue. Aim for quick resolutions without compromising quality.
- Customer Satisfaction (CSAT): A measure of how satisfied customers are with your service. This is usually collected through post-interaction surveys.
- First Response Time: The time it takes to send the first reply to a customer. This sets the tone for the entire interaction.
- Ticket Volume: The number of customer queries your team handles daily or weekly. Tracking this helps you allocate resources effectively.
- Agent Performance: How well your support team is performing. This includes metrics like the number of tickets resolved and customer feedback.
By keeping an eye on these metrics, you can identify bottlenecks, celebrate wins, and continuously improve your service.
How to Set Up a Customer Service Dashboard
Setting up a customer service dashboard doesn’t have to be complicated. Here’s a step-by-step guide to get you started:
- Choose the Right Tool: Look for a dashboard tool that’s easy to use and integrates with your existing systems. (Hint: Our [Customer Service Dashboard] is a great option!)
- Identify Key Metrics: Decide which metrics matter most to your business. Focus on the ones that align with your goals.
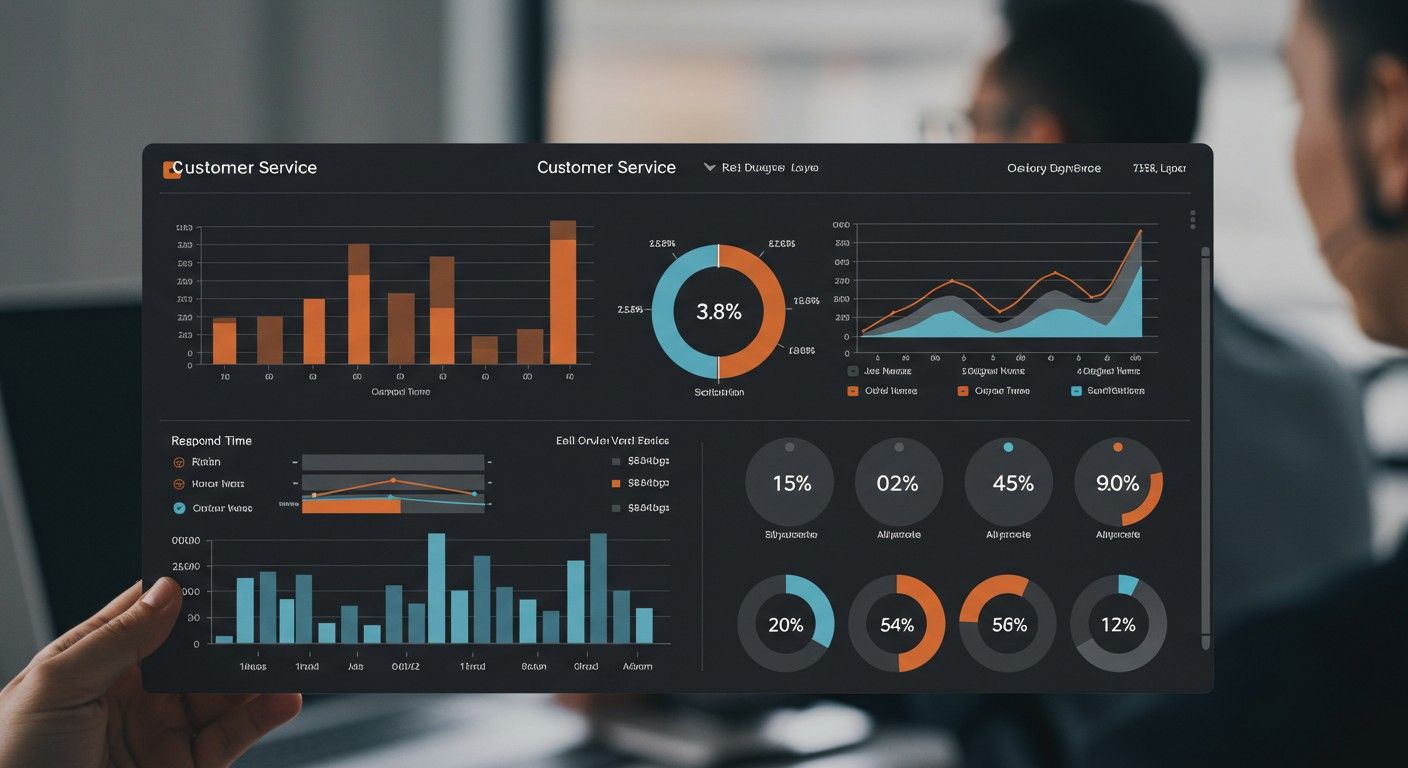
- Customize Your Dashboard: Add widgets, charts, and graphs to visualize your data. Make sure it’s easy for your team to understand.
- Integrate with Other Tools: Connect your dashboard to your CRM, email, or chat tools for seamless data flow.
- Train Your Team: Ensure everyone knows how to use the dashboard effectively. Provide training and resources if needed.
With these steps, you’ll have a fully functional dashboard that empowers your team to deliver top-notch service. Want to keep your customer service team on track? A structured schedule can boost efficiency. Check out our 7-Day Printable Weekly Schedule Template to plan your team’s workflow effortlessly!
Real-World Examples of Customer Service Dashboards
Still not sure how a dashboard works in practice? Here are some real-world examples:
- E-Commerce Store: A small online store uses a dashboard to track response times and ensure no customer query goes unanswered. This helps them maintain high customer satisfaction and build loyalty.
- SaaS Company: A software company monitors ticket volume and resolution times to identify peak periods and allocate resources accordingly. This keeps their support team efficient and responsive.
- Call Center: A call center uses a dashboard to track agent performance and provide feedback. This helps them improve service quality and reduce resolution times.
These examples show how a dashboard can be tailored to different industries and needs. Ensuring safety and compliance in customer service environments is just as important as tracking performance. If you need to audit workplace safety, our Safety Audit Checklist Template can help streamline the process.
Free Customer Service Dashboard Template
To make things even easier, we’ve created a free template for you to use. This template includes pre-built widgets for tracking key metrics like response time, resolution time, and customer satisfaction. Simply download it, customize it to your needs, and start using it right away.
Tips for Using a Customer Service Dashboard Effectively
Once your dashboard is up and running, here are some tips to get the most out of it:
- Regularly Review Data: Check your dashboard daily or weekly to stay on top of trends and issues.
- Focus on Key Metrics: Don’t get overwhelmed by data. Focus on the metrics that matter most to your business.
- Use Visuals: Charts and graphs make data easier to understand at a glance.
- Encourage Team Collaboration: Share dashboard insights with your team to foster collaboration and accountability.
- Continuously Improve: Use the data to identify areas for improvement and celebrate successes.
Conclusion
A customer service dashboard isn’t just a tool—it’s your secret weapon for delivering exceptional service. By tracking key metrics, staying organized, and making data-driven decisions, you can transform your support operations and keep your customers happy.
Ready to take your customer service to the next level? Try our Customer Service Dashboard today and see the difference for yourself. Your customers (and your team) will thank you!