Home
Contact Us
About Us
Shop
Animal
Business
Education
Farm
Finance
Health
Home
HR
Office
Org Charts
Pets
Planners
Procurement
Project Management
QMS
Real Estate
Recruitment
Resume/Cv
Safety HSE
Sales & Marketing
Smart Goals
Transportation
Travel & Tourism
Other
How To Buy Template
Home
Contact Us
About Us
Shop
Animal
Business
Education
Farm
Finance
Health
Home
HR
Office
Org Charts
Pets
Planners
Procurement
Project Management
QMS
Real Estate
Recruitment
Resume/Cv
Safety HSE
Sales & Marketing
Smart Goals
Transportation
Travel & Tourism
Other
How To Buy Template
My Account
Search for:
Skip to content
Diirzal
Empowering Your Projects with Premium Templates
Categories
Safety – HSE
Human Resource
Recruitment
Finance
Project Management
Planners
Smart Goals
Wedding
Home
Transportation
Sales & Marketing
Pets Templates
Online Store
Farm Template
Animal
Categories
Safety – HSE
Human Resource
Recruitment
Finance
Project Management
Planners
Smart Goals
Wedding
Home
Transportation
Sales & Marketing
Pets Templates
Online Store
Farm Template
Animal
Cart
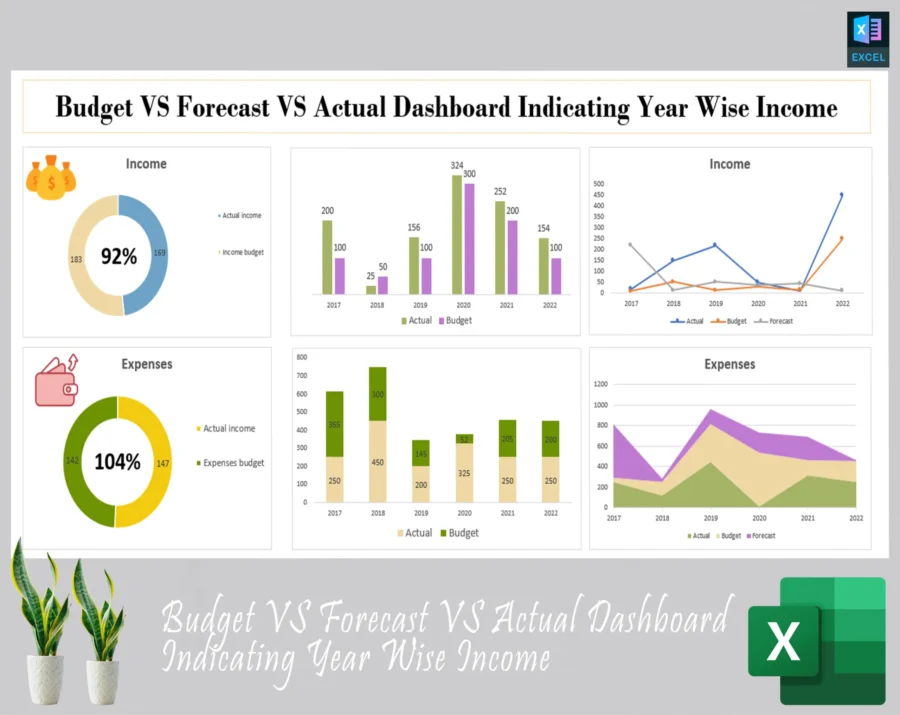
“Forecast vs Budget vs Actual Dashboard | Track Income, Expenses & Variance Easily” has been added to your cart.
Continue shopping
Remove item
Thumbnail image
Product
Price
Quantity
Subtotal
×
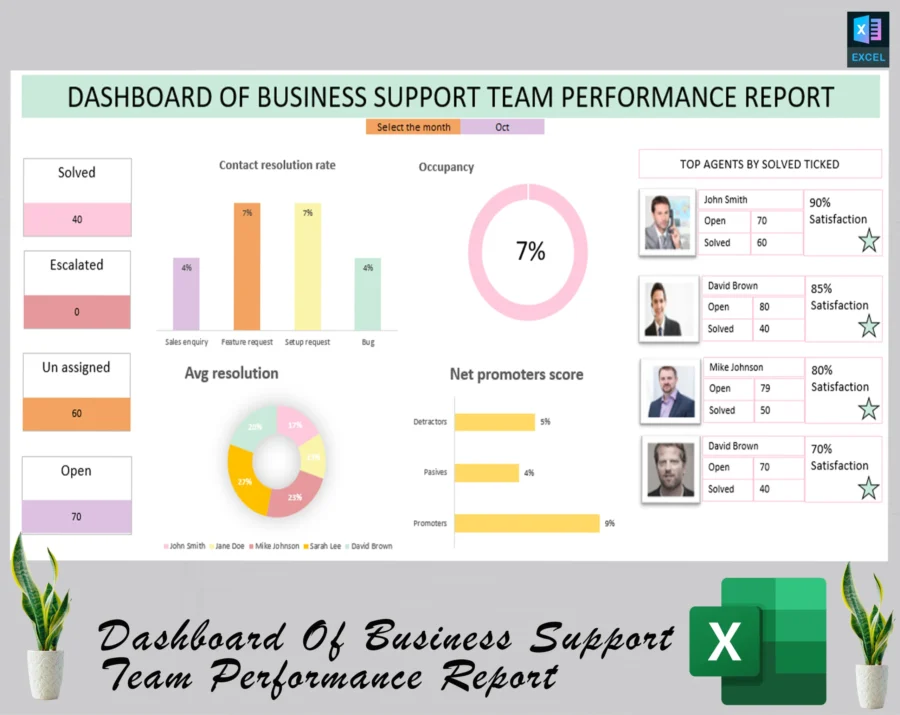
Optimize Results with the Business Performance Management Dashboard – Track Team Success Effortlessly
8
$
Optimize Results with the Business Performance Management Dashboard – Track Team Success Effortlessly quantity
8
$
×
Forecast vs Budget vs Actual Dashboard | Track Income, Expenses & Variance Easily
4
$
Forecast vs Budget vs Actual Dashboard | Track Income, Expenses & Variance Easily quantity
4
$
Update cart
Cart totals
Subtotal
12
$
Total
12
$
Proceed to checkout
Forecast vs Budget vs Actual Dashboard | Track Income, Expenses & Variance Easily
4
$
+
-
Optimize Results with the Business Performance Management Dashboard – Track Team Success Effortlessly
8
$
+
-
Total
12
$
Cart
Checkout
Continue Shopping
2