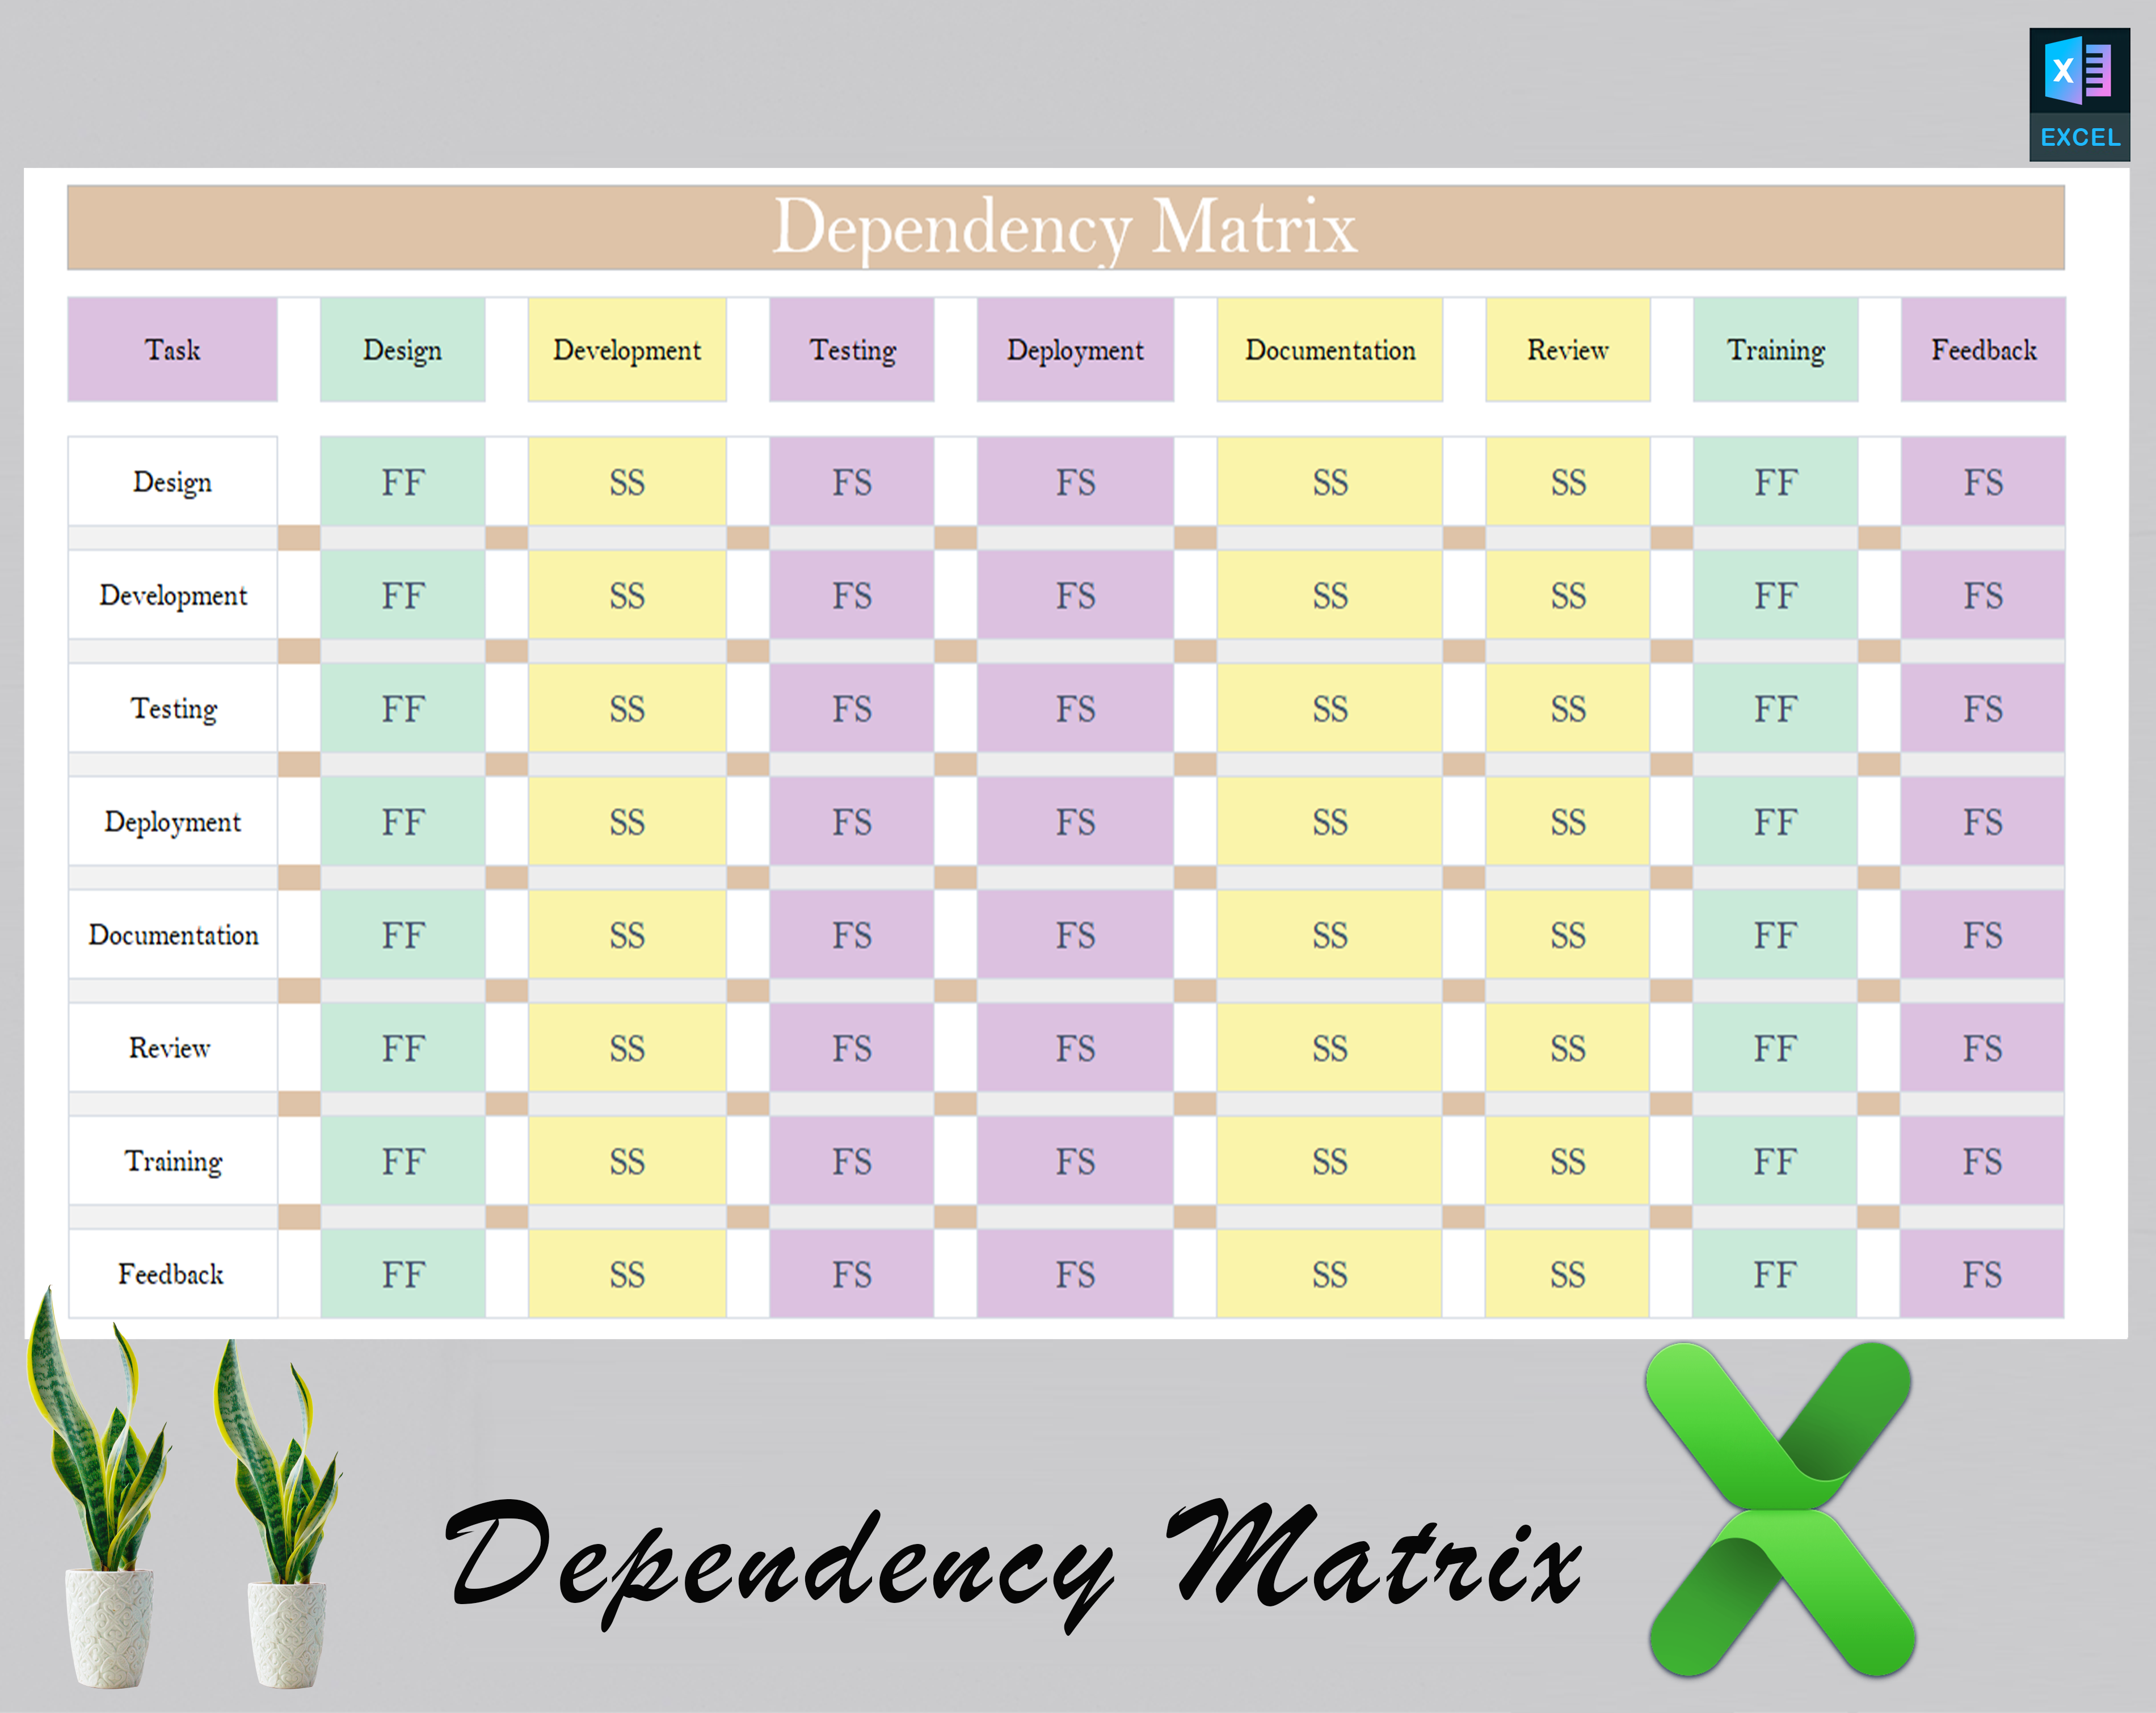
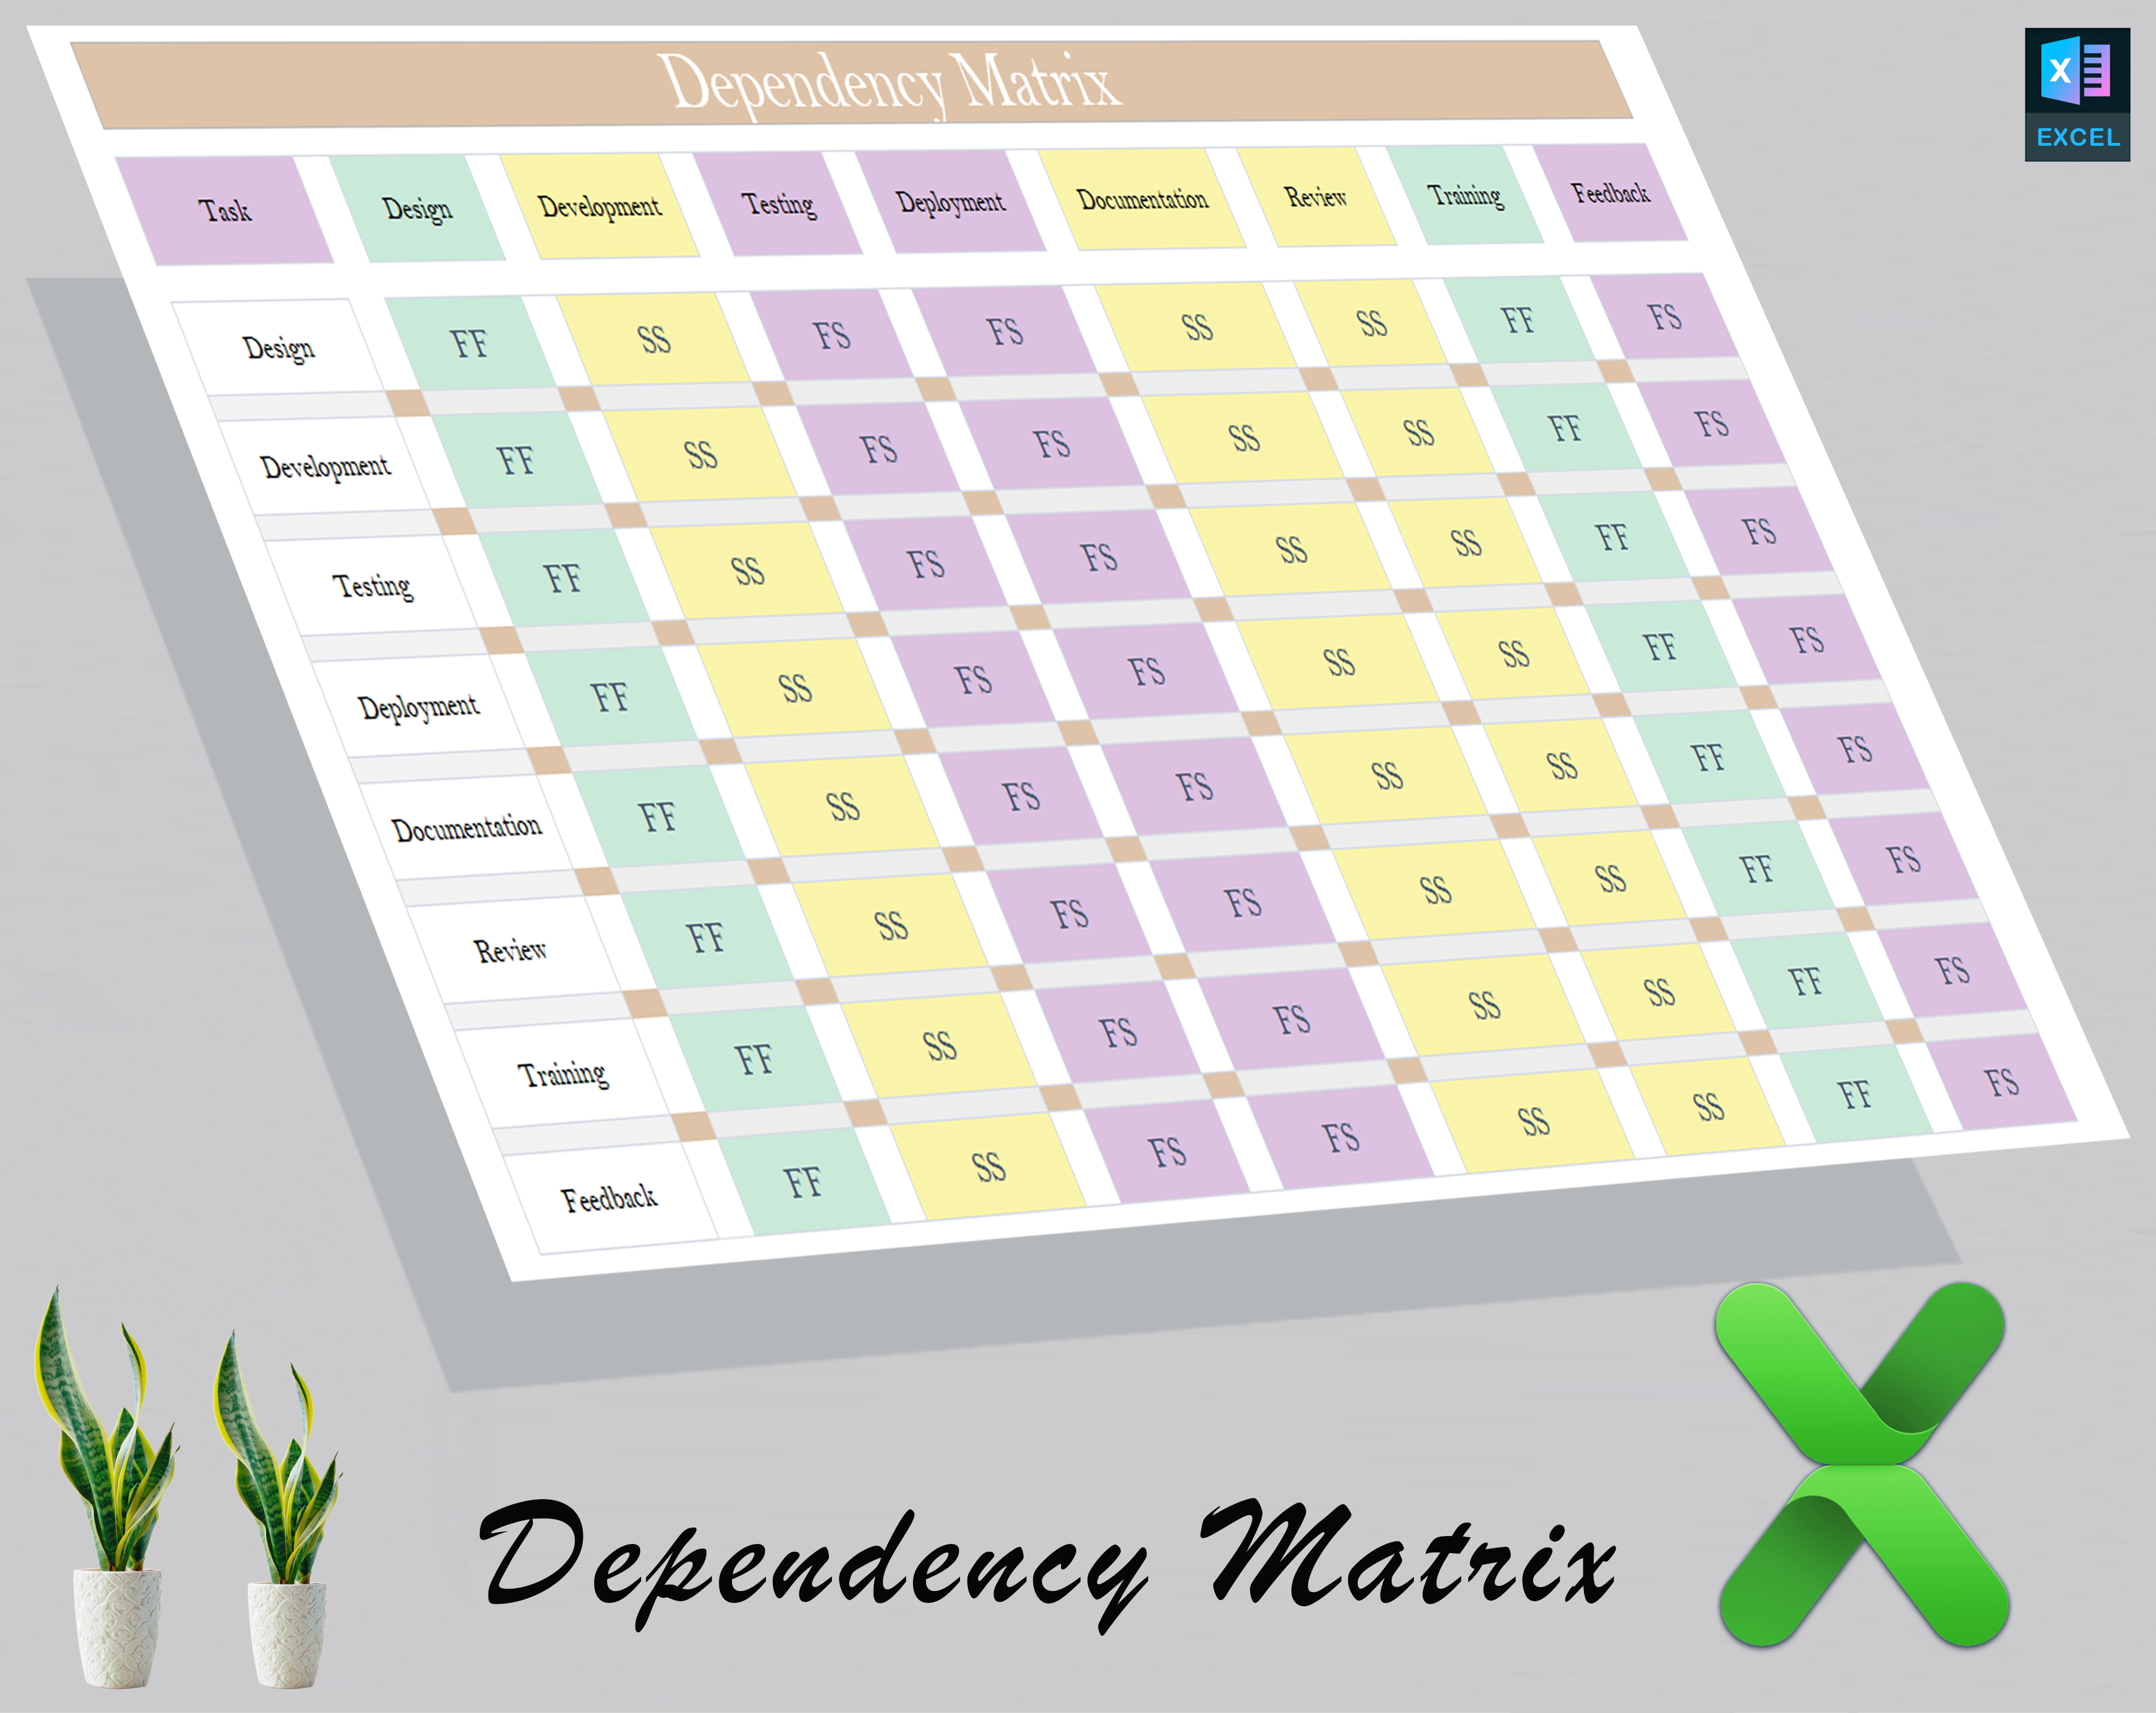
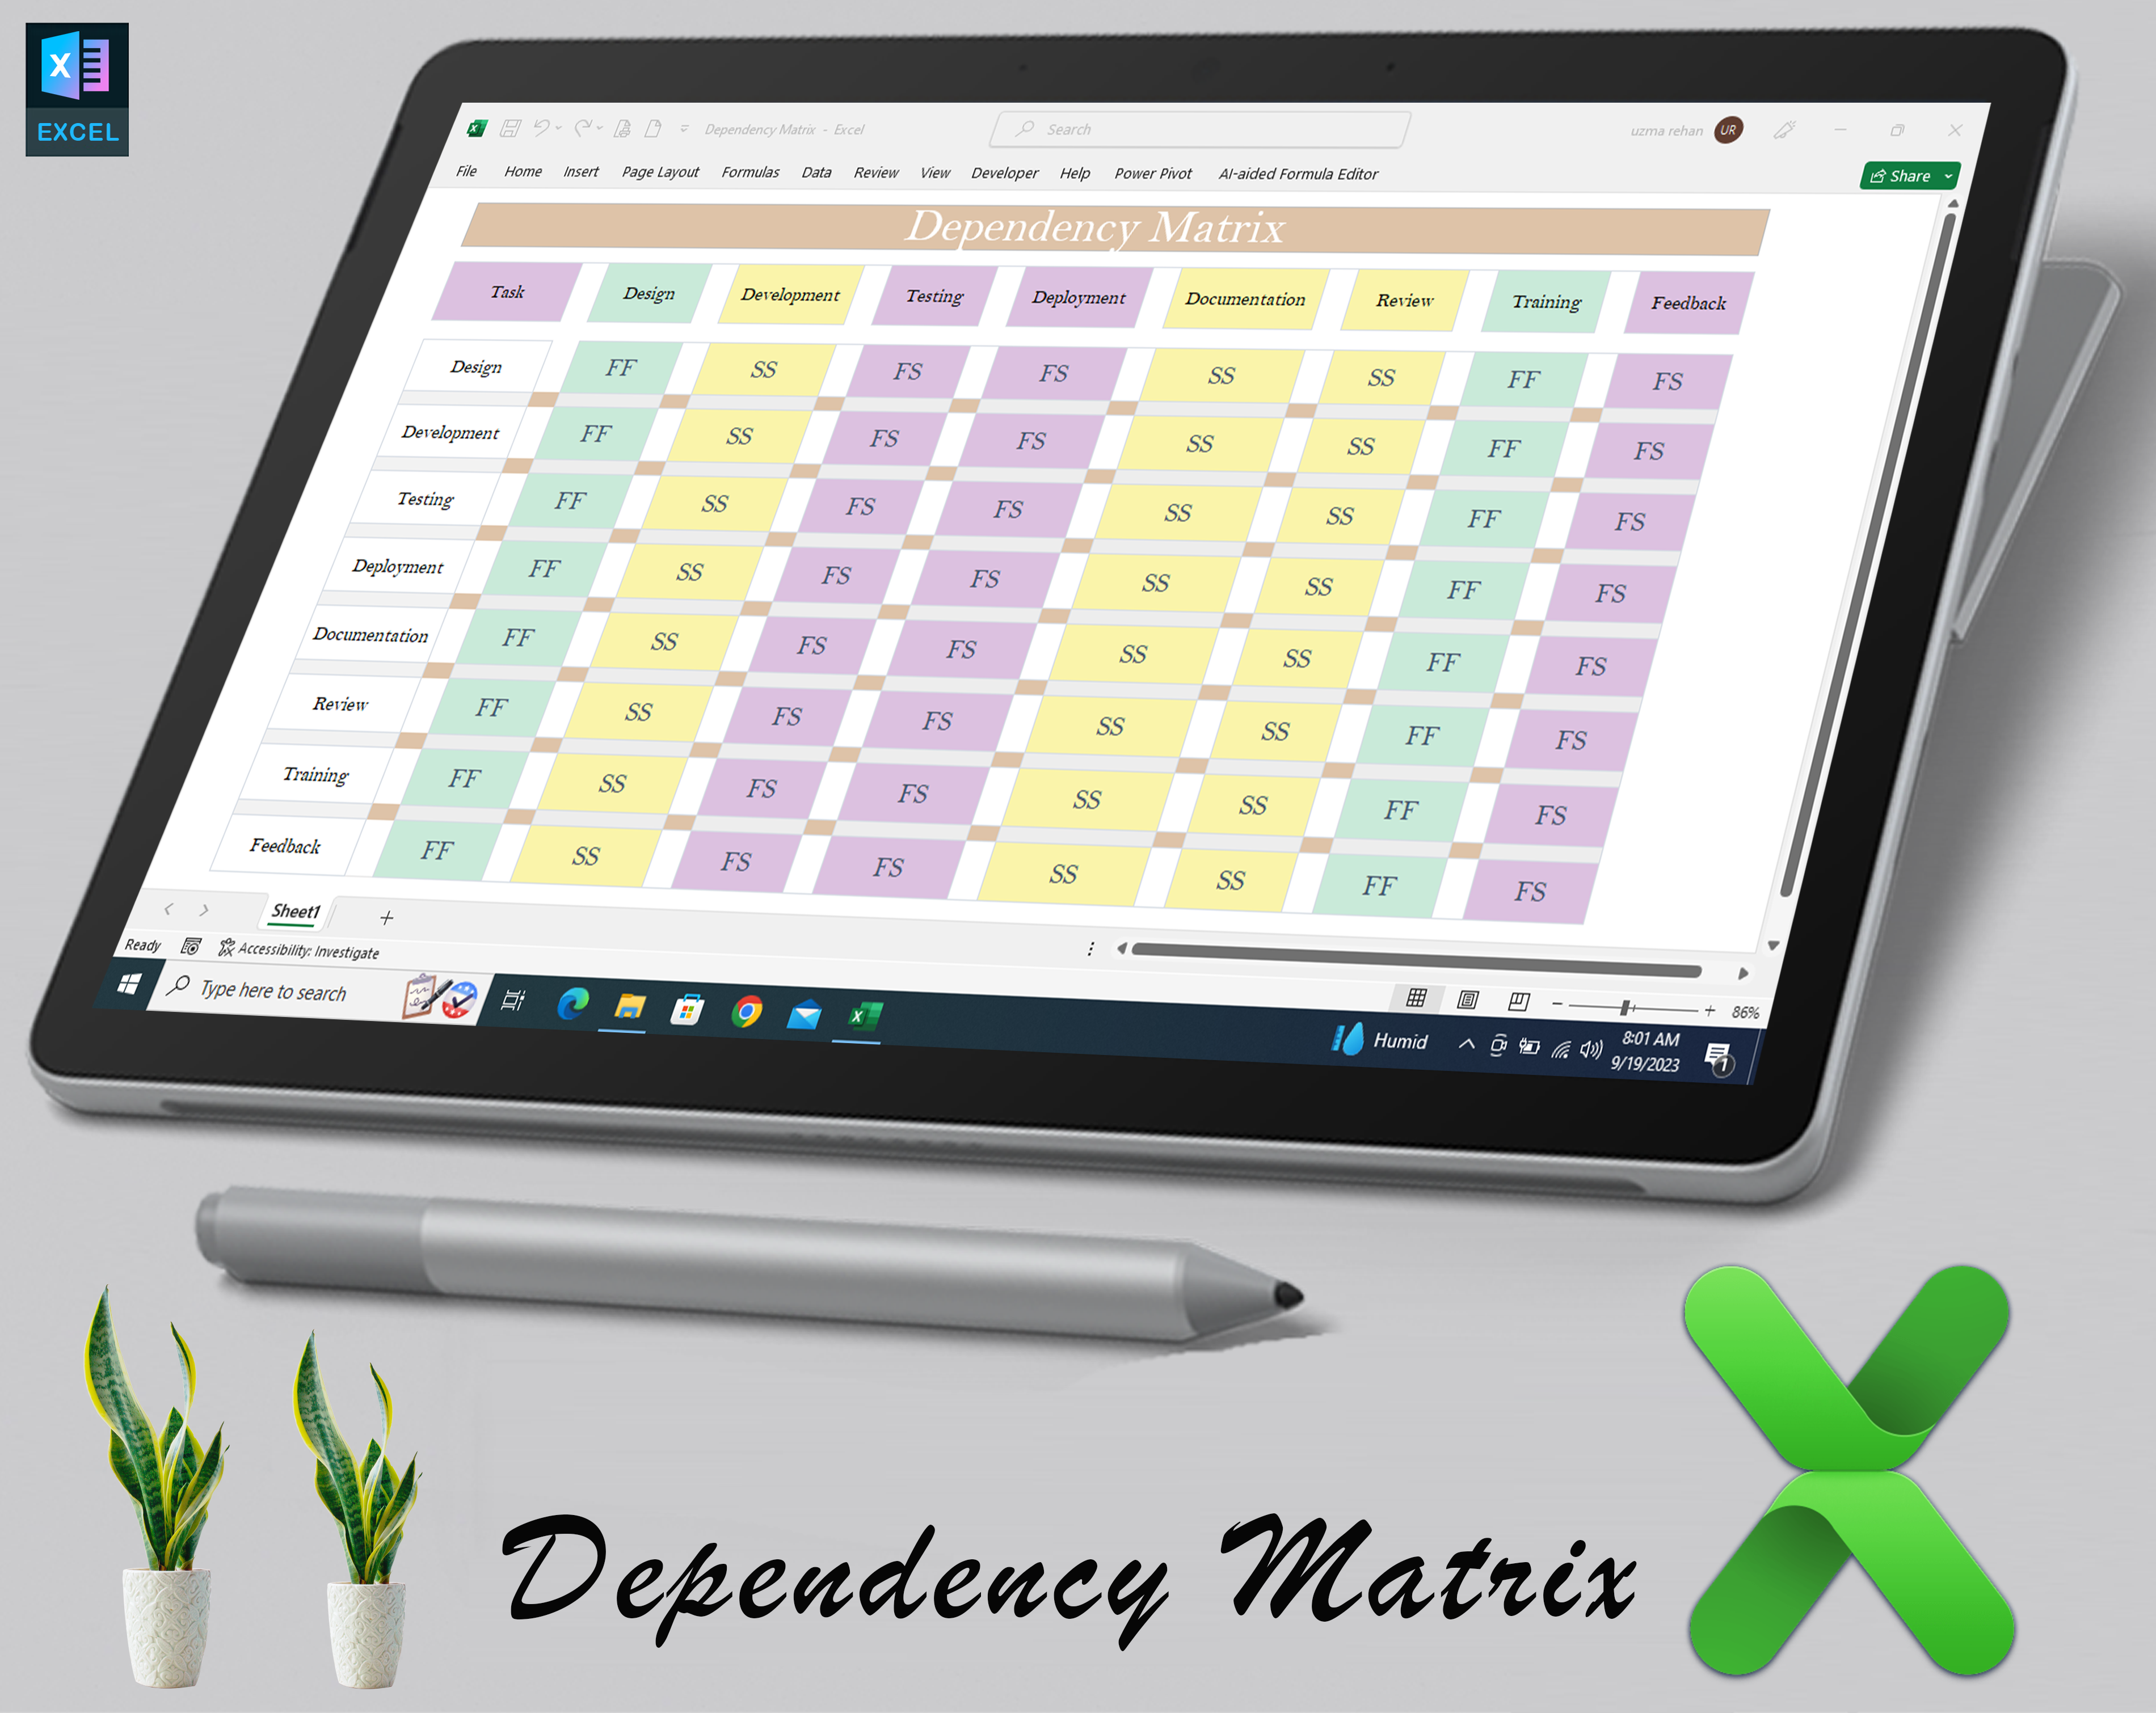
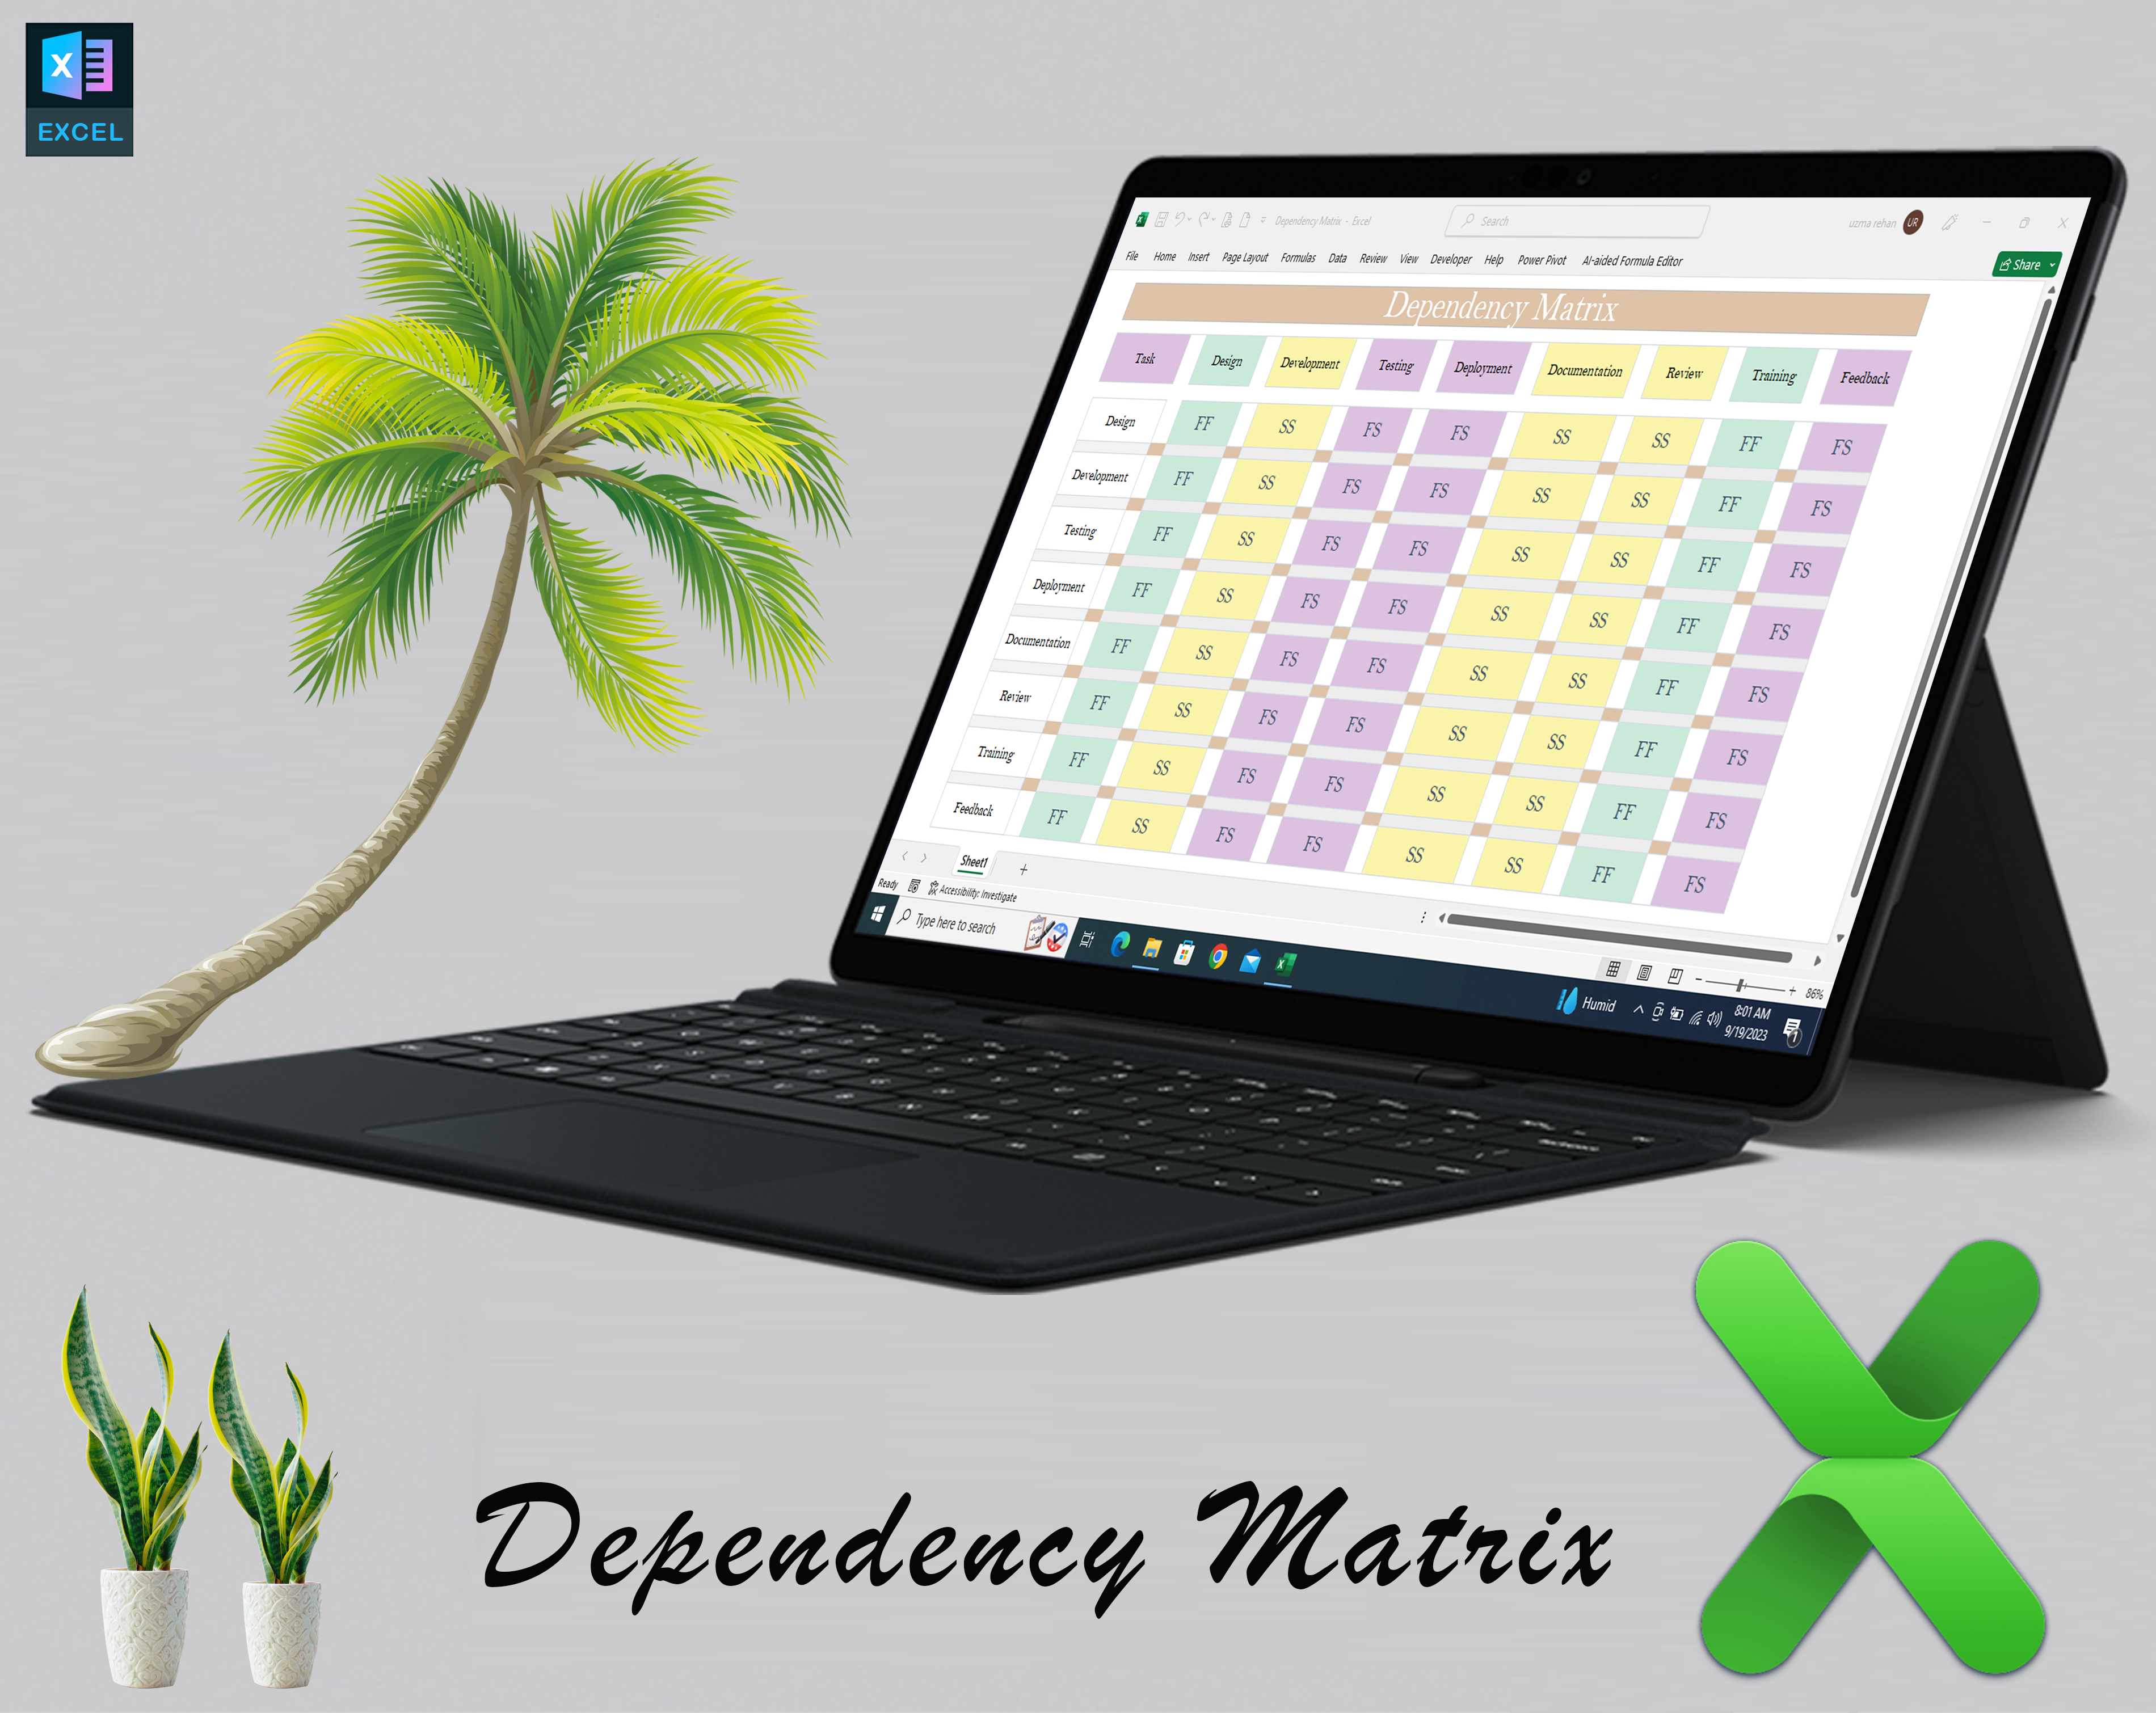
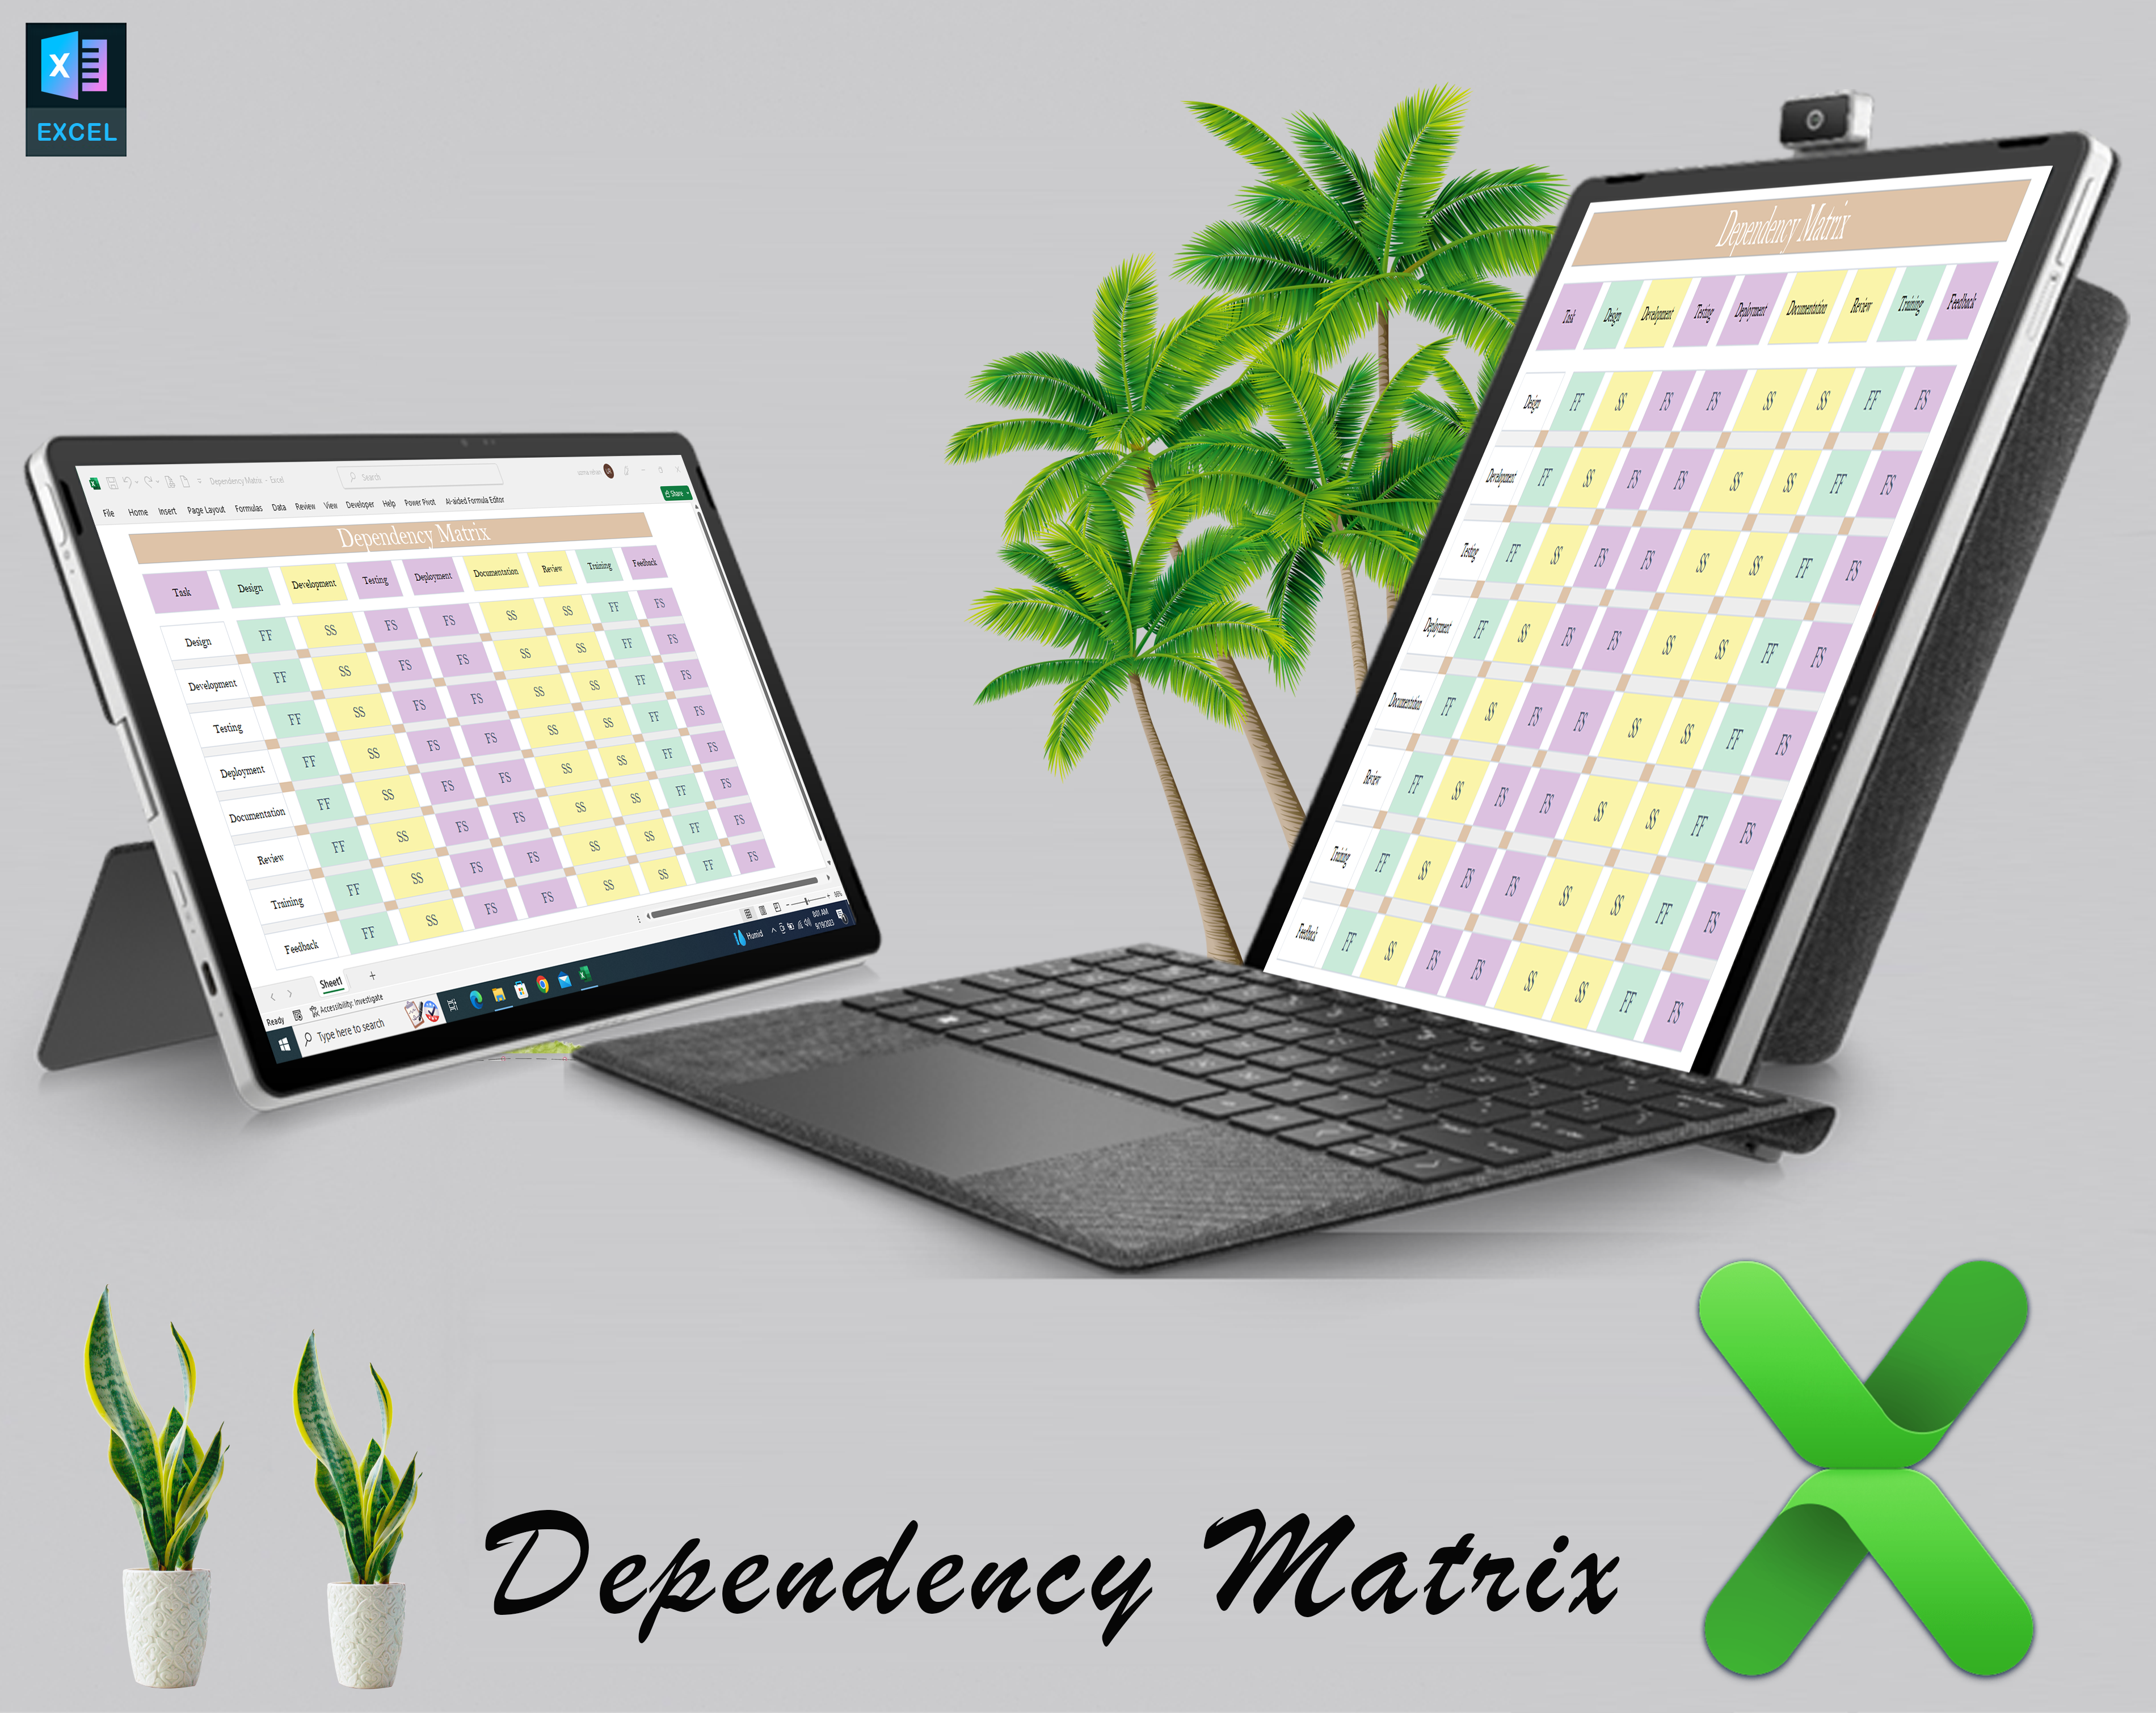
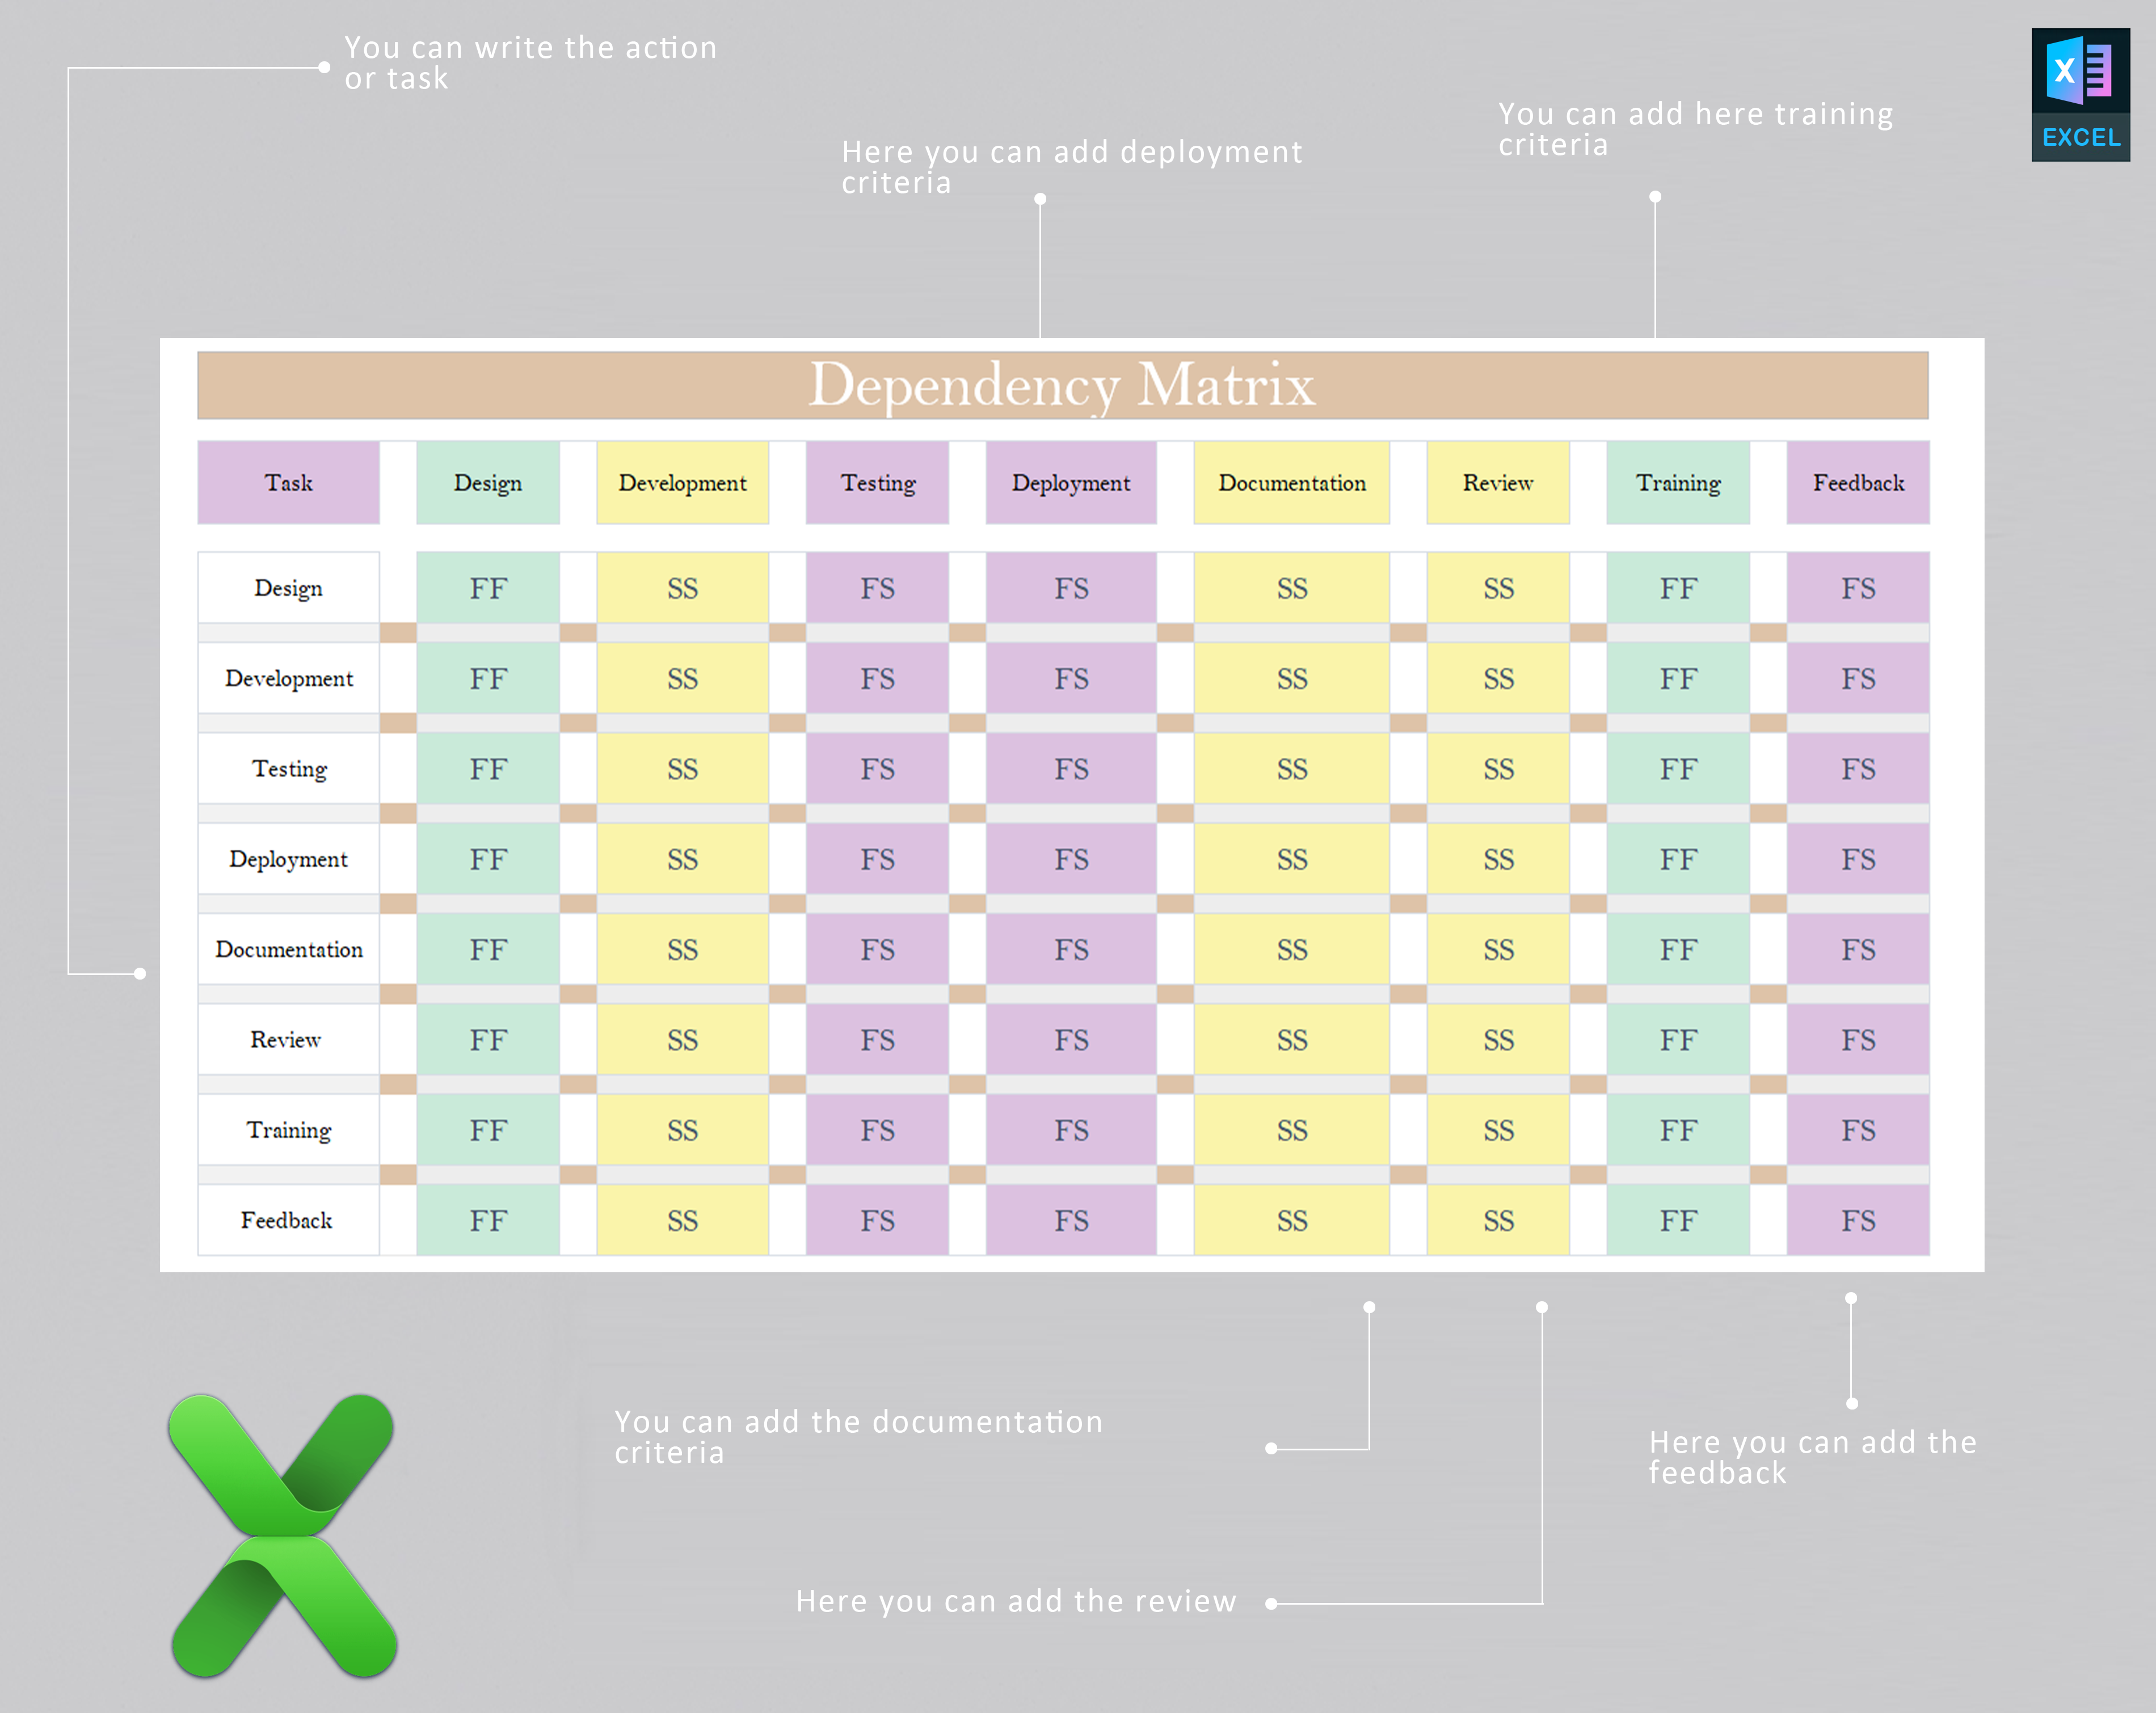
The Dependency Matrix is an essential tool for effectively managing project dependencies. It’s designed to help project managers, engineers, and teams map out the relationships between tasks and resources, ensuring a smoother and more organized workflow. Whether you’re working on a small project or handling large-scale enterprise initiatives, this tool offers unmatched clarity in task management, resource allocation, and project scheduling.
By providing a clear, visual representation of task dependencies, the Dependency Matrix helps you prevent project delays caused by overlooked interdependencies. It enables efficient project planning by making it easier to prioritize tasks and allocate resources where they’re needed most. It also empowers teams to communicate better, ensuring all team members understand how their tasks interconnect.
With its intuitive design and flexibility, the Dependency Matrix is ideal for:
- Visualizing Project Dependencies: See how every task connects and understand the flow of the project at a glance.
- Improved Task Coordination: Ensure that dependent tasks are aligned and completed in the correct order.
- Efficient Resource Allocation: Allocate resources wisely by understanding task interdependencies.
- Enhanced Risk Management: Identify potential risks early by examining critical task dependencies and their effects on the overall project timeline.
- Optimized Workflow: Prioritize tasks based on their dependency mapping to keep the project on track.
Whether you’re handling a complex project, creating a design structure matrix, or mapping system dependencies, the Dependency Matrix provides clarity, ensuring your project stays organized and on schedule. It’s a powerful tool for all stages of project management, from planning to execution.
Key Features & Benefits:
- Clear Visual Mapping: Provides a visual representation of task interdependencies, making project execution smoother and more predictable.
- Efficient Project Planning: Helps prioritize tasks based on their dependencies, ensuring proper sequence and reducing delays.
- Improved Communication: Ensures that everyone on the team understands how tasks relate to each other and their role in the workflow.
- Flexible & Customizable: Comes with customizable templates to fit any project, whether large or small.
- Risk Mitigation: Easily spot potential bottlenecks in your project timeline and adjust accordingly.
- Streamlined Resource Management: Ensure that resources are allocated to the right tasks at the right time to maximize productivity.
Who Can Benefit:
- Project Managers looking to streamline task management and avoid delays caused by overlooked dependencies.
- System Engineers needing to map system dependencies and analyze interrelationships within complex systems.
- Product Managers seeking to optimize cross-functional workflows and resource allocation.
- Project Teams who need a visual aid to understand task dependencies and coordinate efforts effectively.
Product Specifications:
- Product Type: Dependency Mapping Tool
- Formats: Available in customizable templates for Excel, PowerPoint, and PDF.
- Compatibility: Works with major project management tools like Trello, Asana, and Microsoft Project.
- Usage: Ideal for task management, project planning, workflow dependencies, resource allocation, and risk management.
- Customization: Templates include project dependency matrix template, design structure matrix, and system dependency matrix.
- Supports: Integration with task management software for easy project tracking.
FAQs
Can the Dependency Matrix be used for both small and large projects?
Yes, the Dependency Matrix is highly flexible and can be customized to suit the needs of both small and large-scale projects. It helps simplify complex systems by providing a clear visual map of task interdependencies, making it easier to manage any project size.
How can I customize the Dependency Matrix for my specific project?
The Dependency Matrix offers various templates, including the project dependency matrix template and design structure matrix. You can customize these templates in formats such as Excel, PowerPoint, or PDF, adapting them to your unique project requirements.
Is this tool helpful for project risk management?
Absolutely! The Dependency Matrix helps identify resource conflicts, task bottlenecks, and critical dependencies early on, allowing you to take action and mitigate project risks before they cause delays.
Can the Dependency Matrix be used in conjunction with other project management tools?
Yes, the Dependency Matrix is compatible with major project management software like Trello, Asana, and Microsoft Project, making it easy to integrate into your existing project management workflows.
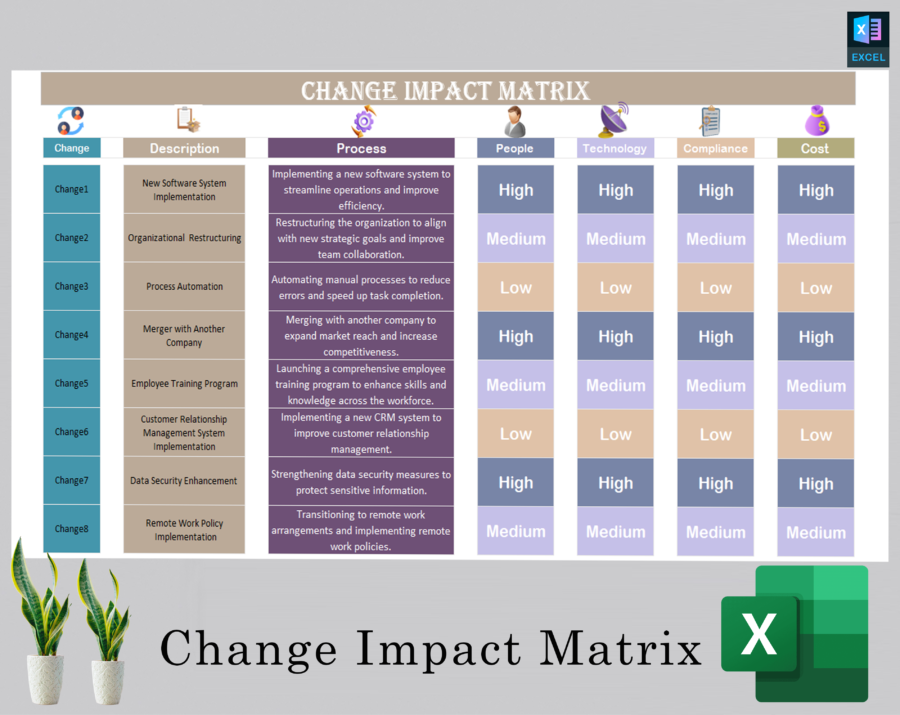
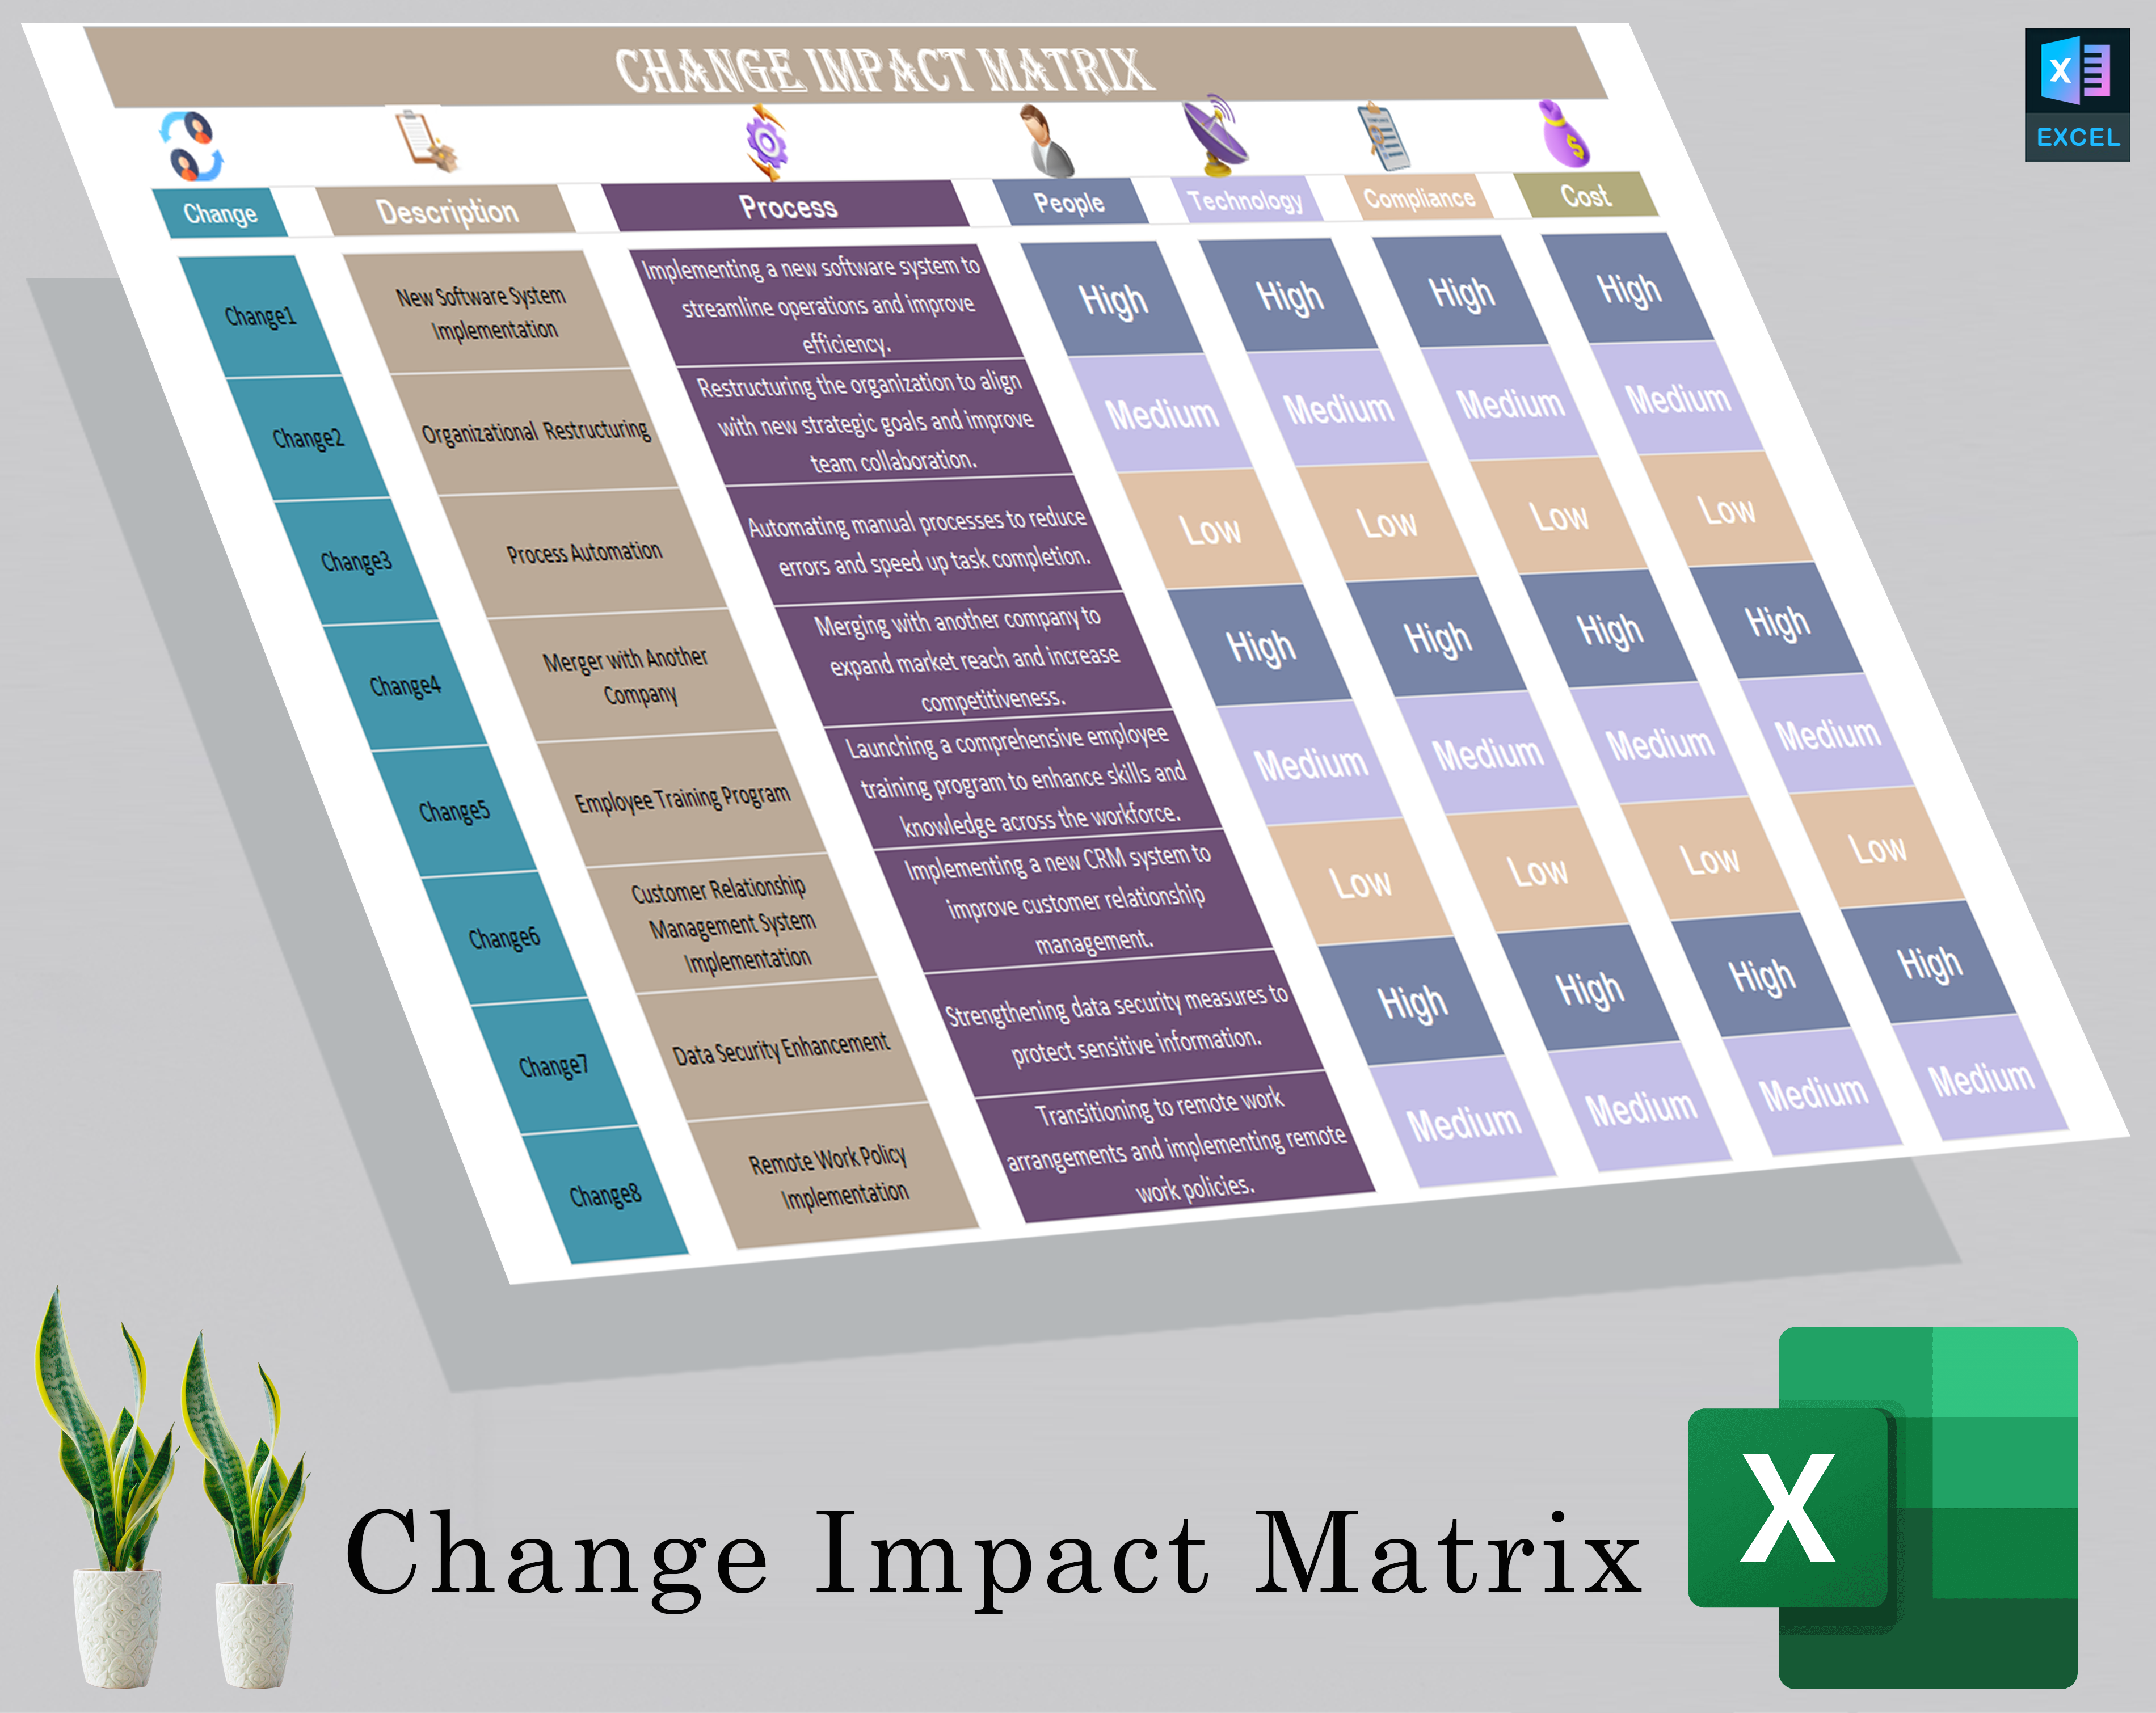
2 reviews for Dependency Matrix – Streamline Project Dependencies & Task Management
There are no reviews yet.