


Managing finances effectively is crucial for any business, and our Forecast vs Budget vs Actual Dashboard makes it easier than ever. This comprehensive tool allows you to compare your budgeted income and expenses with actual figures, providing a clear picture of your financial performance. Whether you’re a business owner, accountant, or financial planner, this dashboard is designed to help you stay on top of your finances and make data-driven decisions.
Key Features
- Year-Wise Tracking: Monitor income and expenses over multiple years to identify trends and patterns.
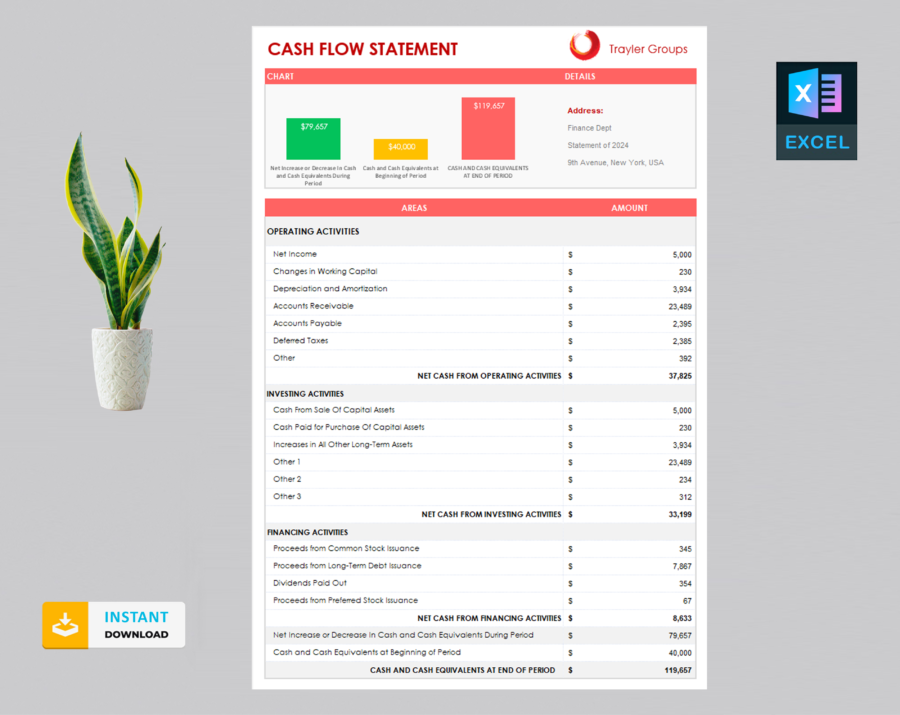
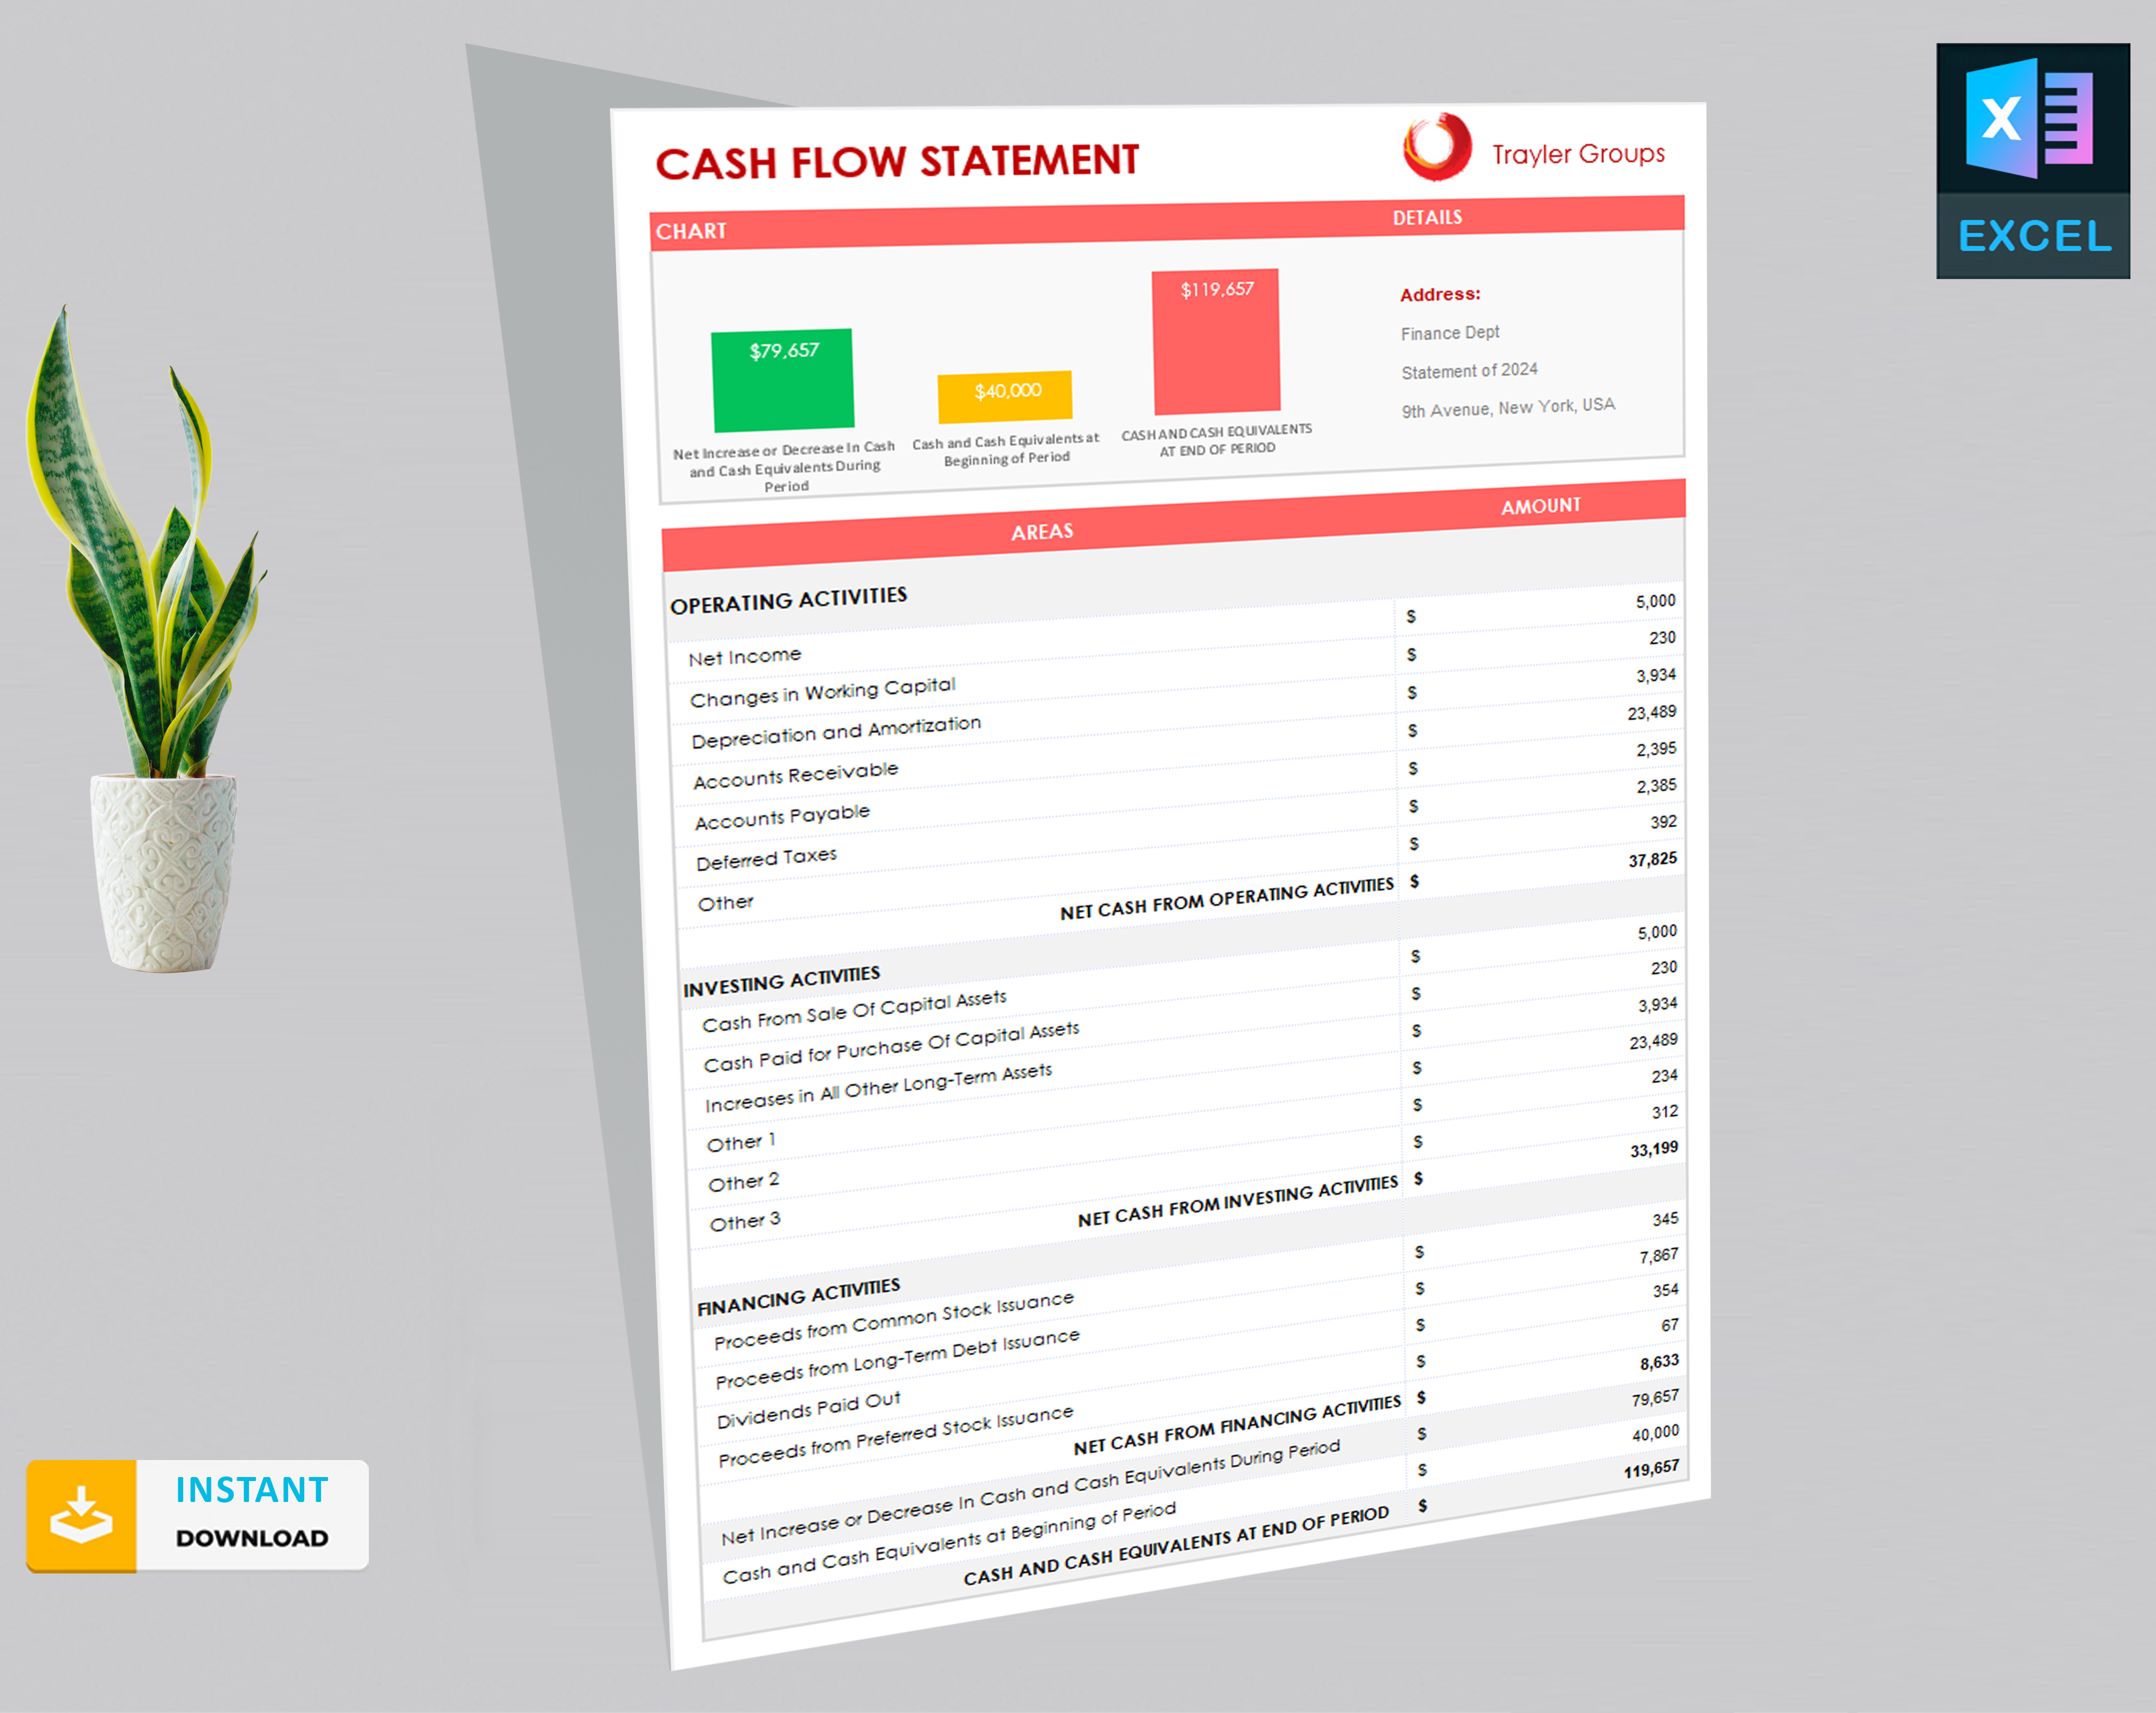
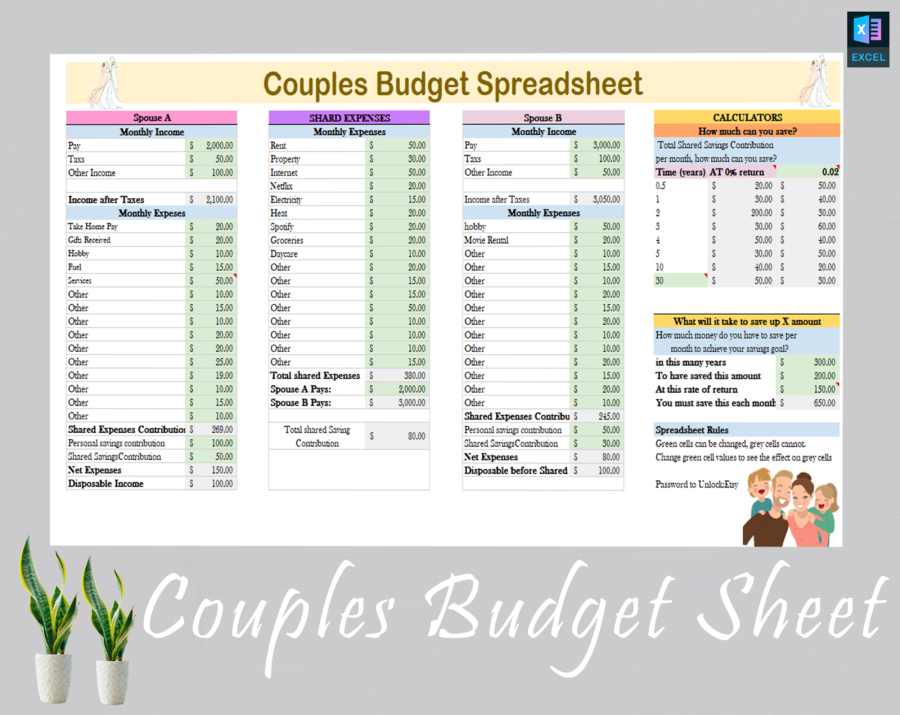
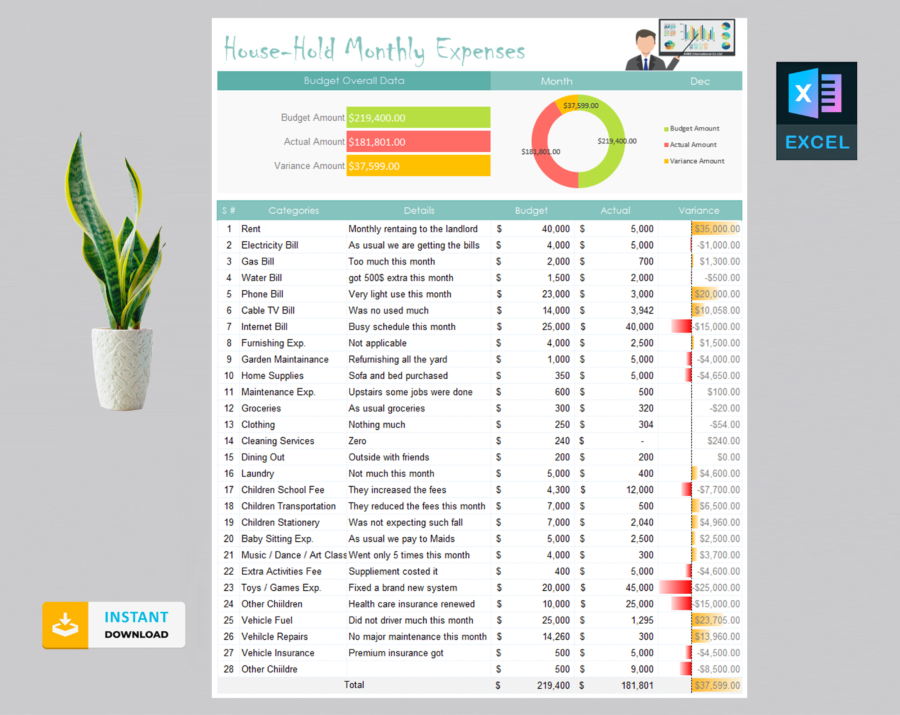
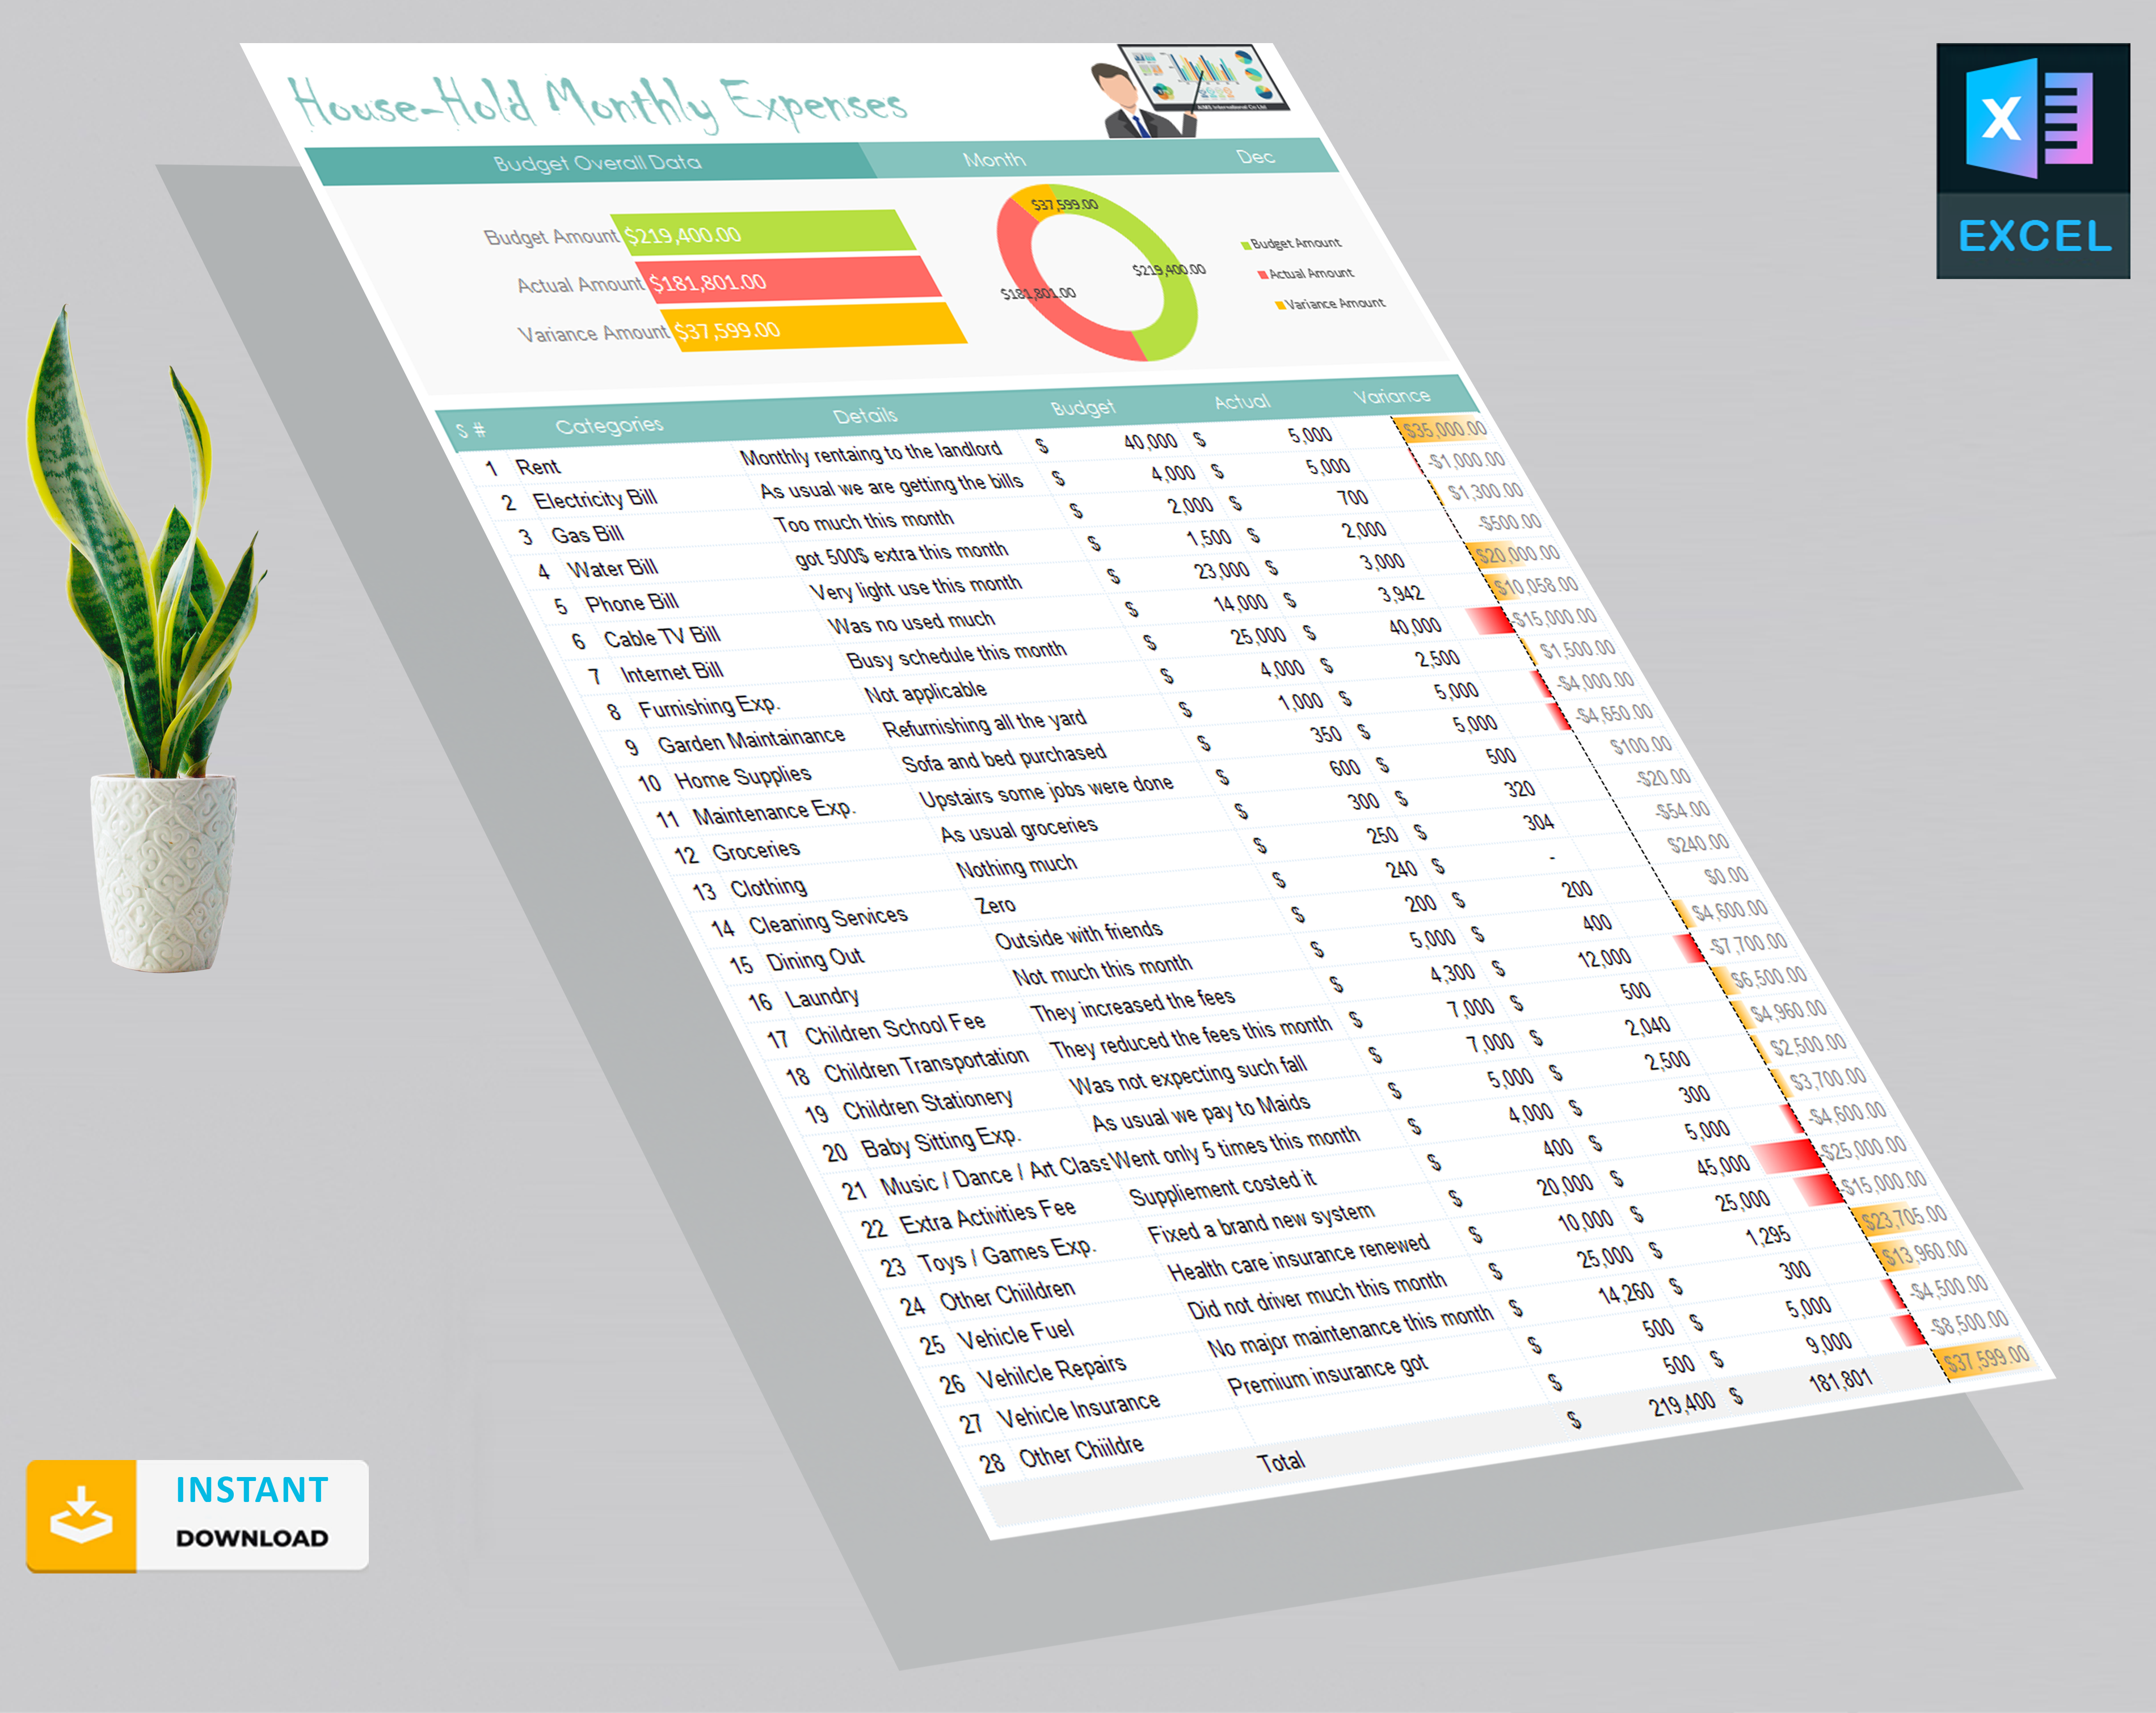
- Budget vs Actual Comparison: Easily compare budgeted figures with actual results to understand variances.
- Expense Tracking: Keep track of all expenses and see how they align with your budget.
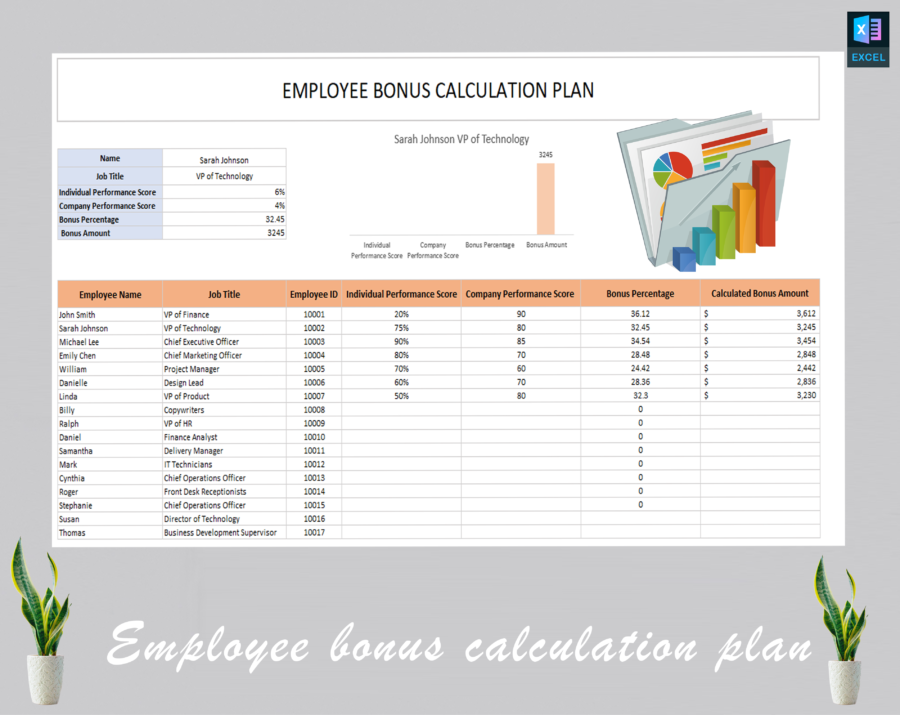
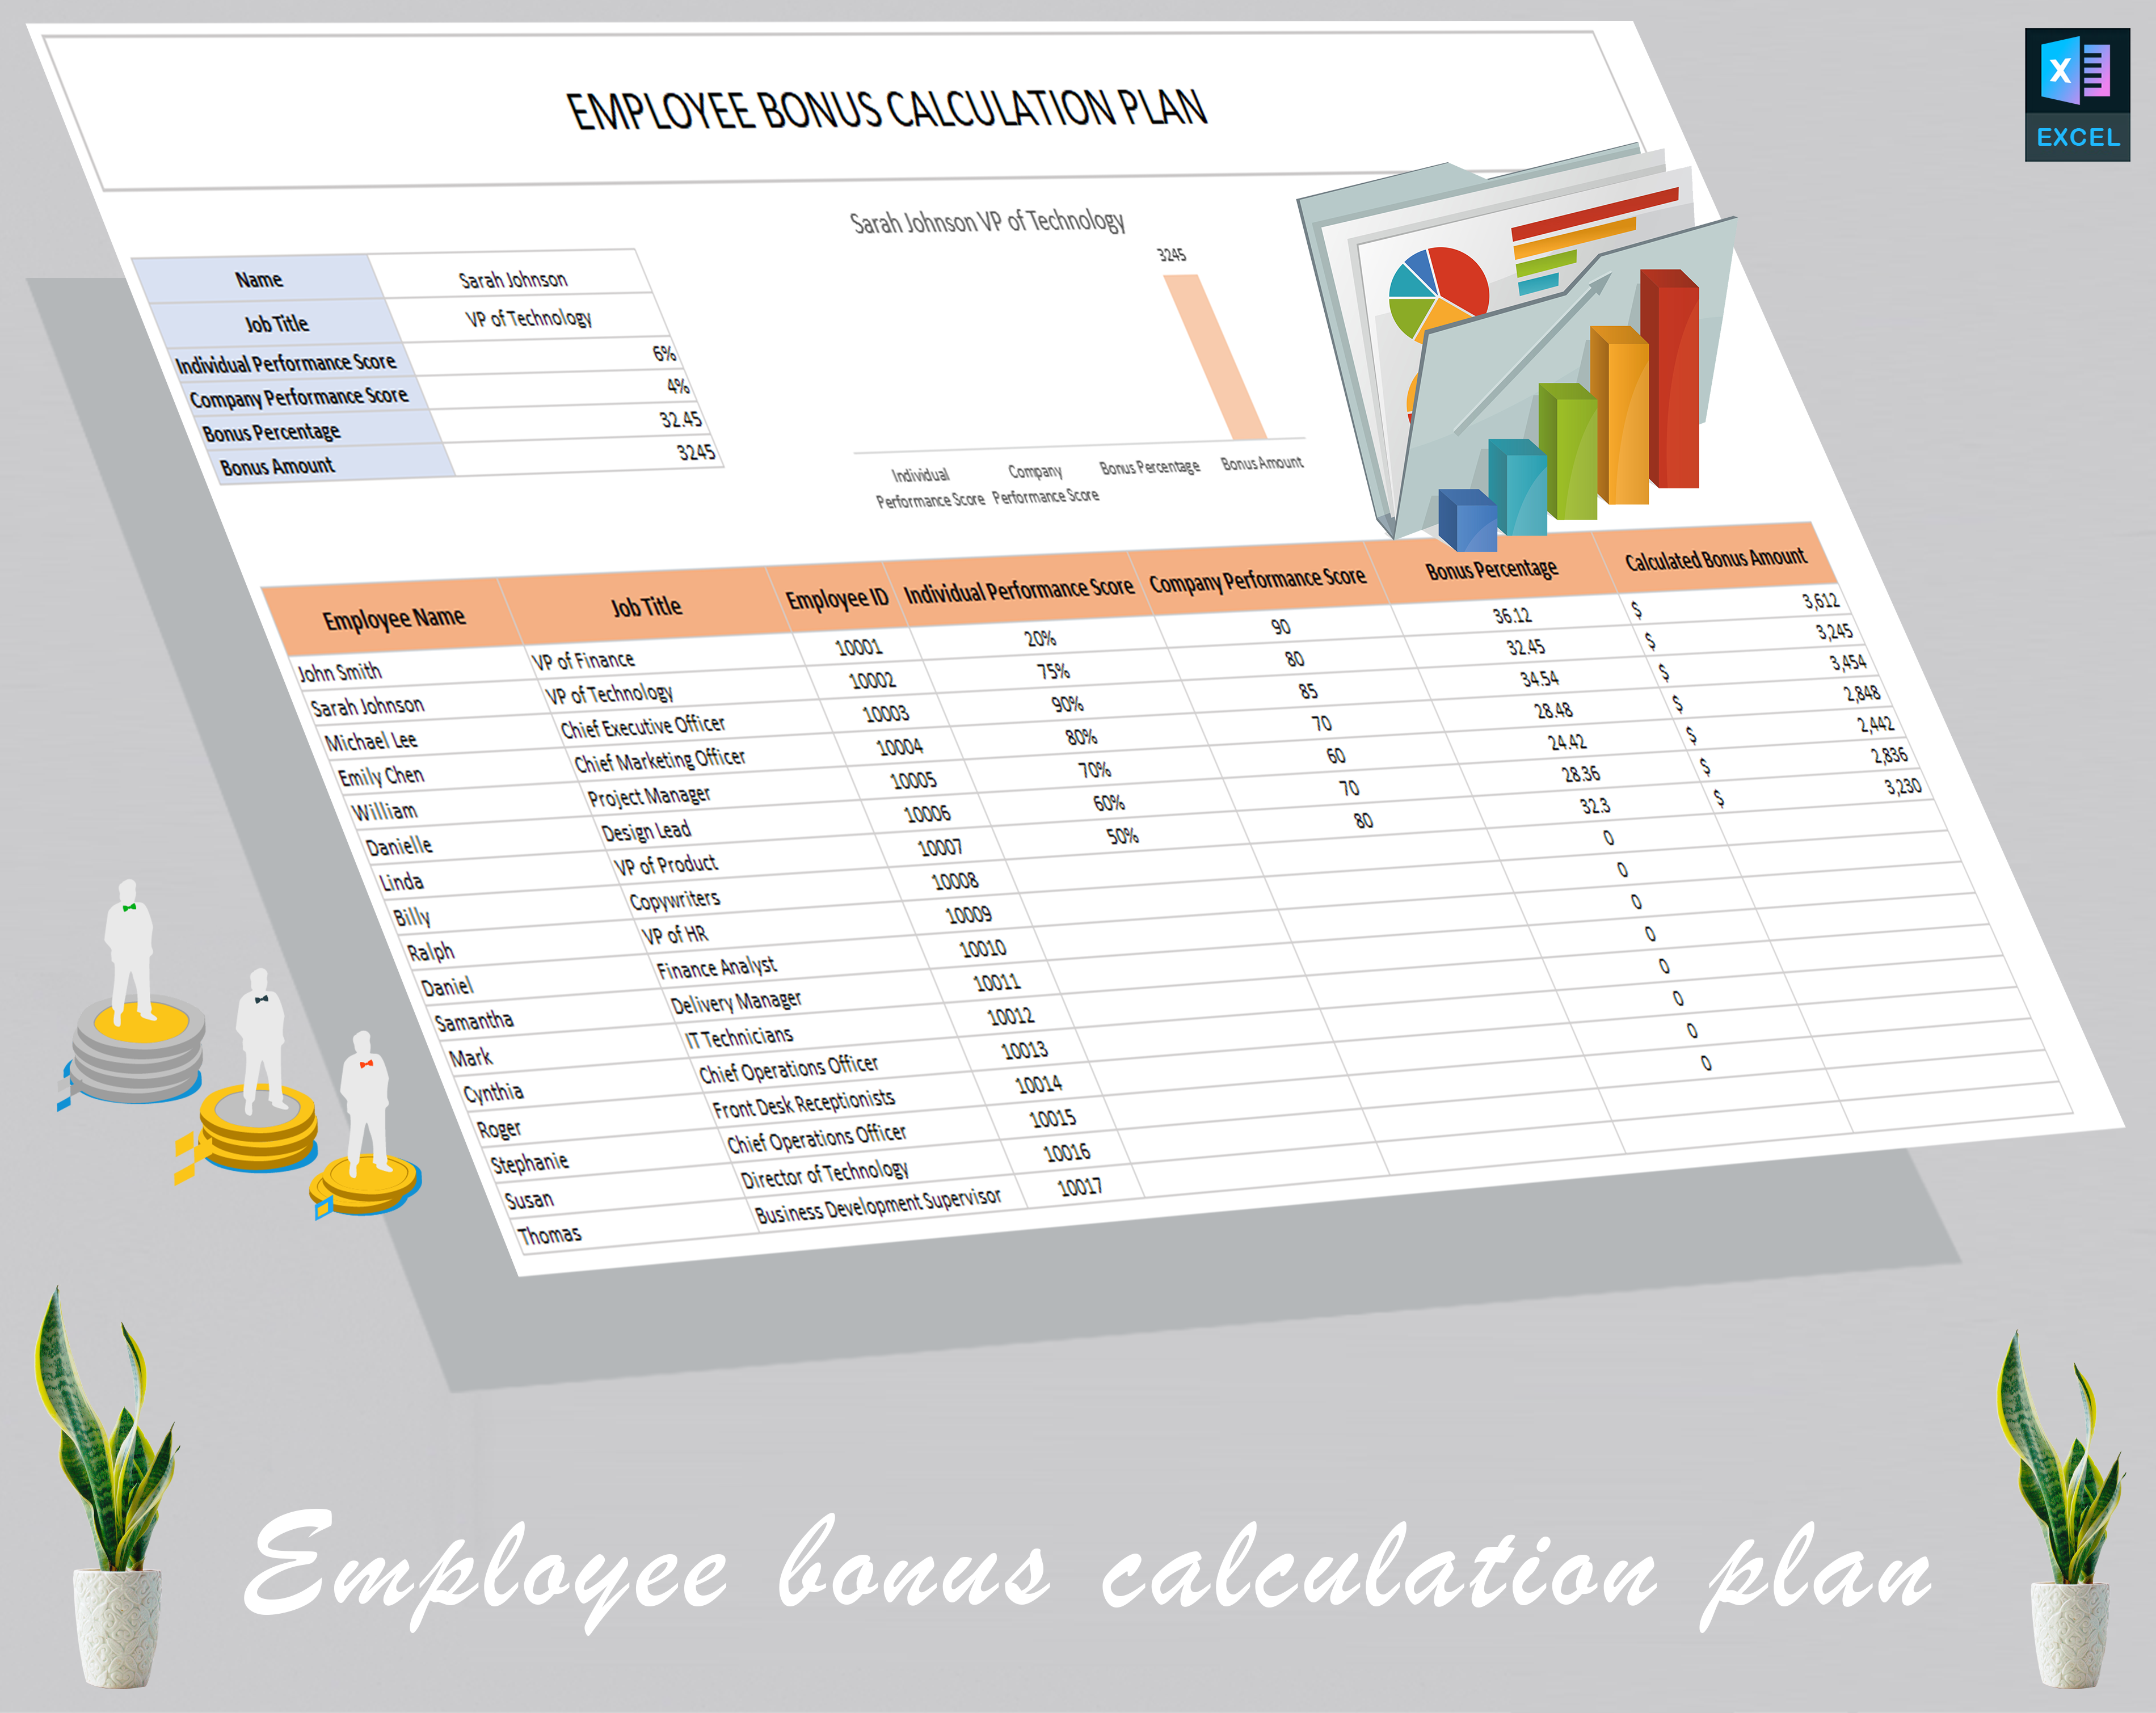
- Income Analysis: Analyze income streams and identify areas for improvement.
- Variance Analysis: Understand the reasons behind budget variances and take corrective actions.
- Customizable Templates: Tailor the dashboard to fit your specific financial needs.
- Visual Reports: Generate easy-to-understand charts and graphs for better insights.
Benefits
- Save Time: Automate financial tracking and get all your data in one place.
- Improve Accuracy: Reduce errors with automated calculations and real-time updates.
- Make Informed Decisions: Use actionable insights to refine your financial strategies.
- Enhance Transparency: Share clear, visual reports with stakeholders to build trust.
- Boost Efficiency: Streamline your financial management process and focus on growth.
Who Is This For?
- Business Owners: Monitor financial performance and make informed decisions.
- Accountants: Simplify financial tracking and reporting.
- Financial Planners: Analyze income and expenses to create better financial plans.
- Managers: Track departmental budgets and ensure financial goals are met.
Product Specifications
- Format: Excel, Power BI, and customizable templates.
- Data Sources: Manual input or integration with financial software.
Metrics Tracked:
- Budgeted income
- Actual income
- Budgeted expenses
- Actual expenses
- Variance analysis
- Reporting: Customizable reports with export options (PDF, Excel).
- Integration: Works with popular financial tools and software.
FAQs:
Can I customize the dashboard to fit my specific needs?
Yes, the dashboard is fully customizable. You can tailor it to fit your specific financial needs, including adding or removing sections and adjusting metrics.
Is the dashboard easy to use for beginners?
Absolutely! The dashboard is designed with a user-friendly interface, making it easy for beginners to navigate and understand key metrics. Customizable templates and visual reports ensure you focus on what matters most.
How does variance analysis work?
The dashboard uses advanced algorithms to compare budgeted figures with actual results, highlighting variances and providing insights into the reasons behind them. This helps you take corrective actions and improve financial performance.
Can I export reports for presentations or sharing?
Yes, you can export reports in PDF or Excel formats, making it easy to share insights with your team, clients, or stakeholders.
33 reviews for Forecast vs Budget vs Actual Dashboard | Track Income, Expenses & Variance Easily
There are no reviews yet.