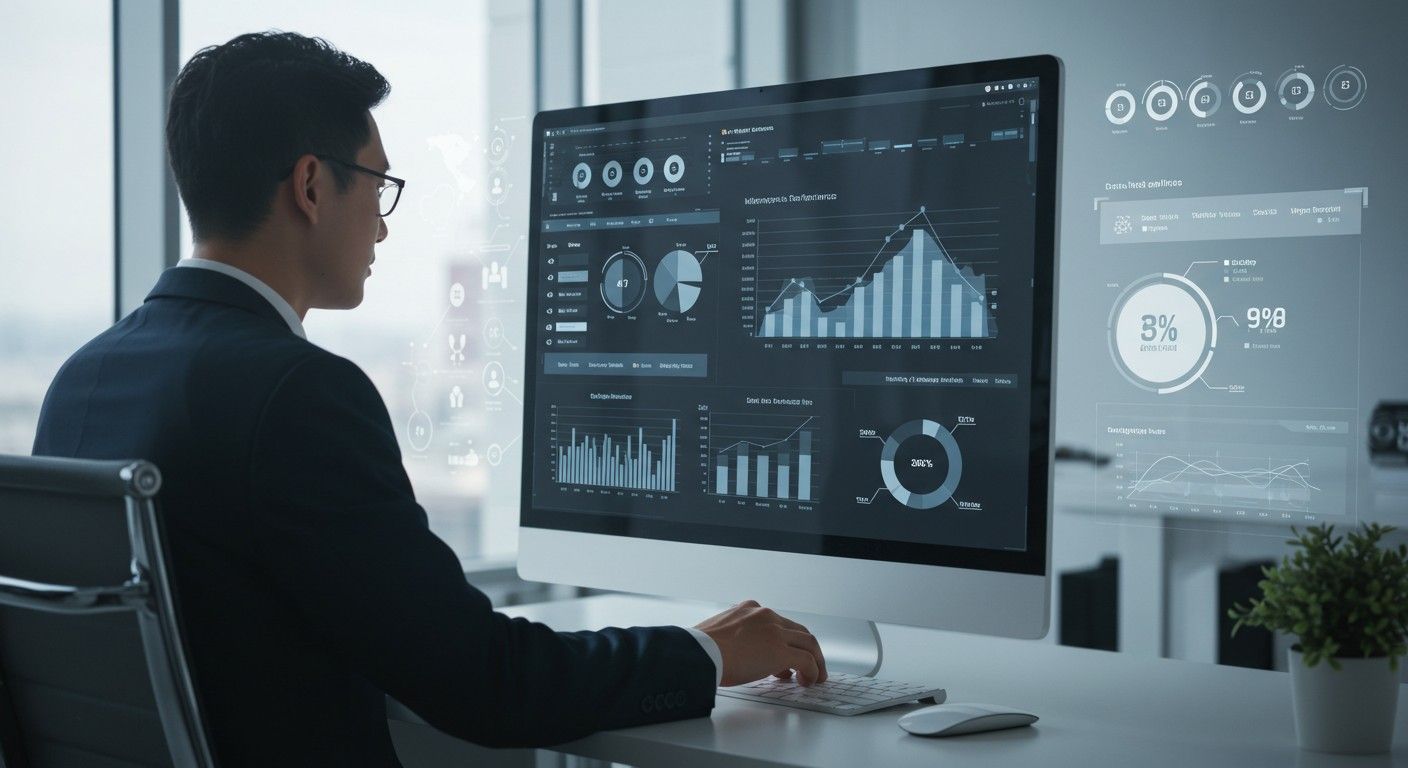
Are you struggling to track key HR metrics effectively? In today’s fast-paced business environment, managing human resources effectively is crucial for any organization’s success. A well-designed HR analytics dashboard can help you visualize and analyze key employee data in a way that improves decision-making, increases productivity, and optimizes overall business performance.
This guide will walk you through the process of how to make an HR analytics dashboard, providing insights on everything from key metrics to the best software tools. By the end, you’ll understand the role of hr analytics dashboard software in transforming your HR data into actionable insights.
What Is an HR Analytics Dashboard?
An HR analytics dashboard is a centralized platform that allows HR professionals to track and analyze data related to their workforce. It brings together key performance indicators (KPIs), employee data, and business metrics in one place. With an HR analytics dashboard, you can monitor metrics such as employee performance, turnover rates, employee satisfaction, and training progress.
The purpose of these dashboards is not only to track HR data but to help companies make more informed decisions. By using a hr analytics dashboard software, you can easily access and interpret data from multiple sources in real-time, providing a comprehensive view of your organization’s human resources. Whether it’s tracking key metrics, understanding employee behavior, or enhancing staff performance, an HR dashboard plays a vital role.
Key Benefits of an HR Analytics Dashboard
- Improved Decision-Making
An HR analytics dashboard empowers decision-makers with real-time data, helping them make informed decisions about recruitment, employee development, and retention strategies. By visualizing important metrics like employee turnover, performance metrics, and KPIs, you can address potential issues before they escalate. - Operational Efficiency
Having a centralized dashboard for tracking HR metrics boosts operational efficiency. By automating data collection and performance tracking, HR departments save valuable time that would otherwise be spent manually gathering reports. This leads to faster decision-making and a reduction in administrative tasks. - Tracking Key Metrics
From employee engagement to financial performance, an HR analytics dashboard lets you track critical metrics across various HR processes. Whether you’re interested in employee satisfaction, benefits administration, or time-to-hire, your dashboard will provide a clear picture of where your business stands. - Better Business Impact
By using an HR dashboard, companies gain a more dynamic approach to managing their workforce. Understanding the performance of human resources in relation to company goals can lead to higher productivity and improved overall business outcomes. In essence, HR analytics dashboard software provides the foundation for continuous improvement. - Building Your HR Analytics Dashboard
Creating an effective HR analytics dashboard involves several steps, from choosing the right software to selecting the most relevant metrics to display. Here’s how to go about it:
- Choose the Right HR Analytics Dashboard Software
The first step in building your HR dashboard is selecting the right software that aligns with your business needs. Consider tools such as Power BI, Tableau, and Qlik, which provide advanced data visualization capabilities. These platforms allow HR professionals to integrate data from multiple sources like QuickBooks, Excel, and other HR management systems. - Identify Key Metrics to Track
The next step is to determine the metrics that matter most to your organization. Whether it’s tracking employee performance, recruitment metrics, or training effectiveness, the metrics you choose will depend on your specific HR goals. Some common metrics to include are employee satisfaction, attrition rates, training success, and engagement levels. - Design Your Dashboard Layout
Once you’ve chosen your software and metrics, the next task is designing the dashboard. A good dashboard design should be simple, intuitive, and easy to understand. Use charts, graphs, and performance indicators to represent data in a meaningful way. This will allow HR professionals to quickly interpret data and take action when necessary. - Integrate Data Sources
Effective HR dashboards pull data from a variety of sources. Ensure that your HR software integrates smoothly with payroll systems, time tracking software, and any other tools that store relevant employee information. The goal is to create a centralized location for all your HR data, making it easier to access and analyze.
To create a fully functional HR analytics dashboard, integrating various data sources is crucial. Along with pulling data from HR software, using scheduling tools like Google Calendar can streamline HR operations. If you’re looking for a structured way to organize HR tasks, check out our detailed guide on Google Weekly Calendar Templates to enhance your workforce planning and scheduling efficiency. - Make It Dynamic and Interactive
One of the key features of modern HR analytics dashboards is their dynamic and interactive nature. Tools like Tableau and Power BI offer interactive visualizations, where HR teams can drill down into specific data points for deeper insights. This interactivity enhances decision-making by allowing users to explore the data further.
By following these steps and using the right hr analytics dashboard software, you’ll be able to create a dashboard that offers powerful insights into your workforce and operations.
Best Tools for HR Analytics Dashboards
There are a variety of tools available to create HR analytics dashboards, each offering different features and capabilities. Here are a few of the best options:
- Tableau
Tableau is a leader in data visualization, allowing HR professionals to create interactive dashboards with ease. You can use it to track employee performance, KPIs, and other HR metrics. Its integration capabilities with various data sources make it ideal for building a comprehensive HR analytics dashboard. - Power BI
Power BI, developed by Microsoft, offers robust reporting and data visualization features that integrate seamlessly with Excel and other Microsoft tools. HR professionals can create dynamic dashboards that track metrics such as employee turnover, engagement, and performance reviews. - Qlik
Qlik is another powerful analytics tool known for its interactive dashboards. It offers a high degree of customization and flexibility, allowing HR professionals to design dashboards that cater to their specific needs. The ability to pull data from multiple sources, including QuickBooks and other HR systems, makes it a strong contender for HR analytics.
By using the right software and customizing it to your needs, you can create an HR dashboard that meets your organization’s unique requirements.
Real-Life Examples of HR Dashboards
To truly understand the power of an HR analytics dashboard, it’s helpful to see it in action. Let’s take a look at a few examples of how companies are using HR dashboards:
- Employee Performance Tracking
Many organizations use HR dashboards to track employee performance over time. This can include metrics like sales performance, engagement, and training progress. By visualizing this data, companies can identify high-performing employees and provide additional support for those who may be struggling. - Recruitment Metrics
HR dashboards are also helpful in streamlining the recruitment process. You can track metrics such as time-to-hire, cost-per-hire, and candidate source to understand where your most successful recruits are coming from. These insights help companies refine their recruitment strategies and improve hiring outcomes. - Turnover Analysis
Another common use of HR dashboards is to analyze employee turnover. By tracking data such as employee retention rates and exit interviews, HR professionals can identify patterns and make improvements to reduce turnover.
Common Challenges When Building HR Dashboards and How to Overcome Them
While building an HR dashboard can bring numerous benefits, there are a few challenges to consider:
- Data Integration
One of the most common challenges in creating an HR dashboard is integrating data from various sources like Excel, QuickBooks, and other HR systems. Ensuring that your hr analytics dashboard software can handle these integrations is crucial for ensuring accurate and reliable data. - Customization
Another challenge is customizing the dashboard to suit the unique needs of your organization. You may need to display certain KPIs or employee metrics that are specific to your business. Ensure that the software you choose allows for easy customization to fit your requirements. - User Adoption
Getting HR teams and staff to use the dashboard effectively can be a challenge. Provide proper training and ensure that the dashboard is user-friendly and easy to navigate to encourage adoption across the organization.
Conclusion
Creating an HR analytics dashboard is one of the best ways to make data-driven decisions in your HR department. By selecting the right hr analytics dashboard software, identifying the key metrics to track, and designing an intuitive dashboard, you can improve your organization’s HR processes and enhance overall business performance. Whether you’re tracking employee performance, engagement, or turnover rates, an HR dashboard provides valuable insights that help you manage your workforce more effectively.
By following the steps outlined in this guide, you’ll be well on your way to building an HR analytics dashboard that provides the insights you need to drive success. Start integrating your HR data today and unlock the power of analytics!
What are the benefits of using an HR analytics dashboard?
An HR analytics dashboard offers several benefits, including improved decision-making through data-driven insights, enhanced operational efficiency by automating data collection, and better tracking of employee performance and engagement. It also allows for more effective business strategy development by providing real-time access to HR metrics and helping identify areas for improvement.
How do I build an HR analytics dashboard?
To build an HR analytics dashboard, you need to follow these steps:
- Choose the right HR analytics dashboard software.
- Identify the key metrics you want to track, such as employee performance, turnover rates, and recruitment metrics.
- Design the dashboard layout for simplicity and clarity, using charts and graphs.
- Integrate your data sources, such as payroll systems and time tracking tools.
- Customize the dashboard based on your organization's unique needs.
Which HR analytics dashboard software is best for my business?
The best HR analytics dashboard software depends on your specific needs. Some popular options include Tableau, Power BI, and Qlik, which offer robust visualization features, real-time data integration, and customization capabilities. These tools allow HR departments to easily track key metrics, visualize employee performance, and generate actionable insights.
Can I track employee performance using an HR analytics dashboard?
Yes, tracking employee performance is one of the key functionalities of an HR analytics dashboard. You can use the dashboard to monitor various metrics, such as sales performance, goal achievement, attendance, and engagement levels. This helps HR teams identify top performers, areas for improvement, and optimize employee development strategies.


